Dear All,
I’m using Icinga 2 and Graphite.
Version details:
icinga2 - The Icinga 2 network monitoring daemon (version: r2.11.3-1)
graphite: v1.1.0
I would like to create graph for hostalive or ping4 service with warning and critical values.
Without warning and critical values the graph drawing appear fine.
When I add warning and critical values to hostalive.ini template under [hostalive-rta.metrics_filters] section, warning and critical values does appear in graph, but in other units/ratio.
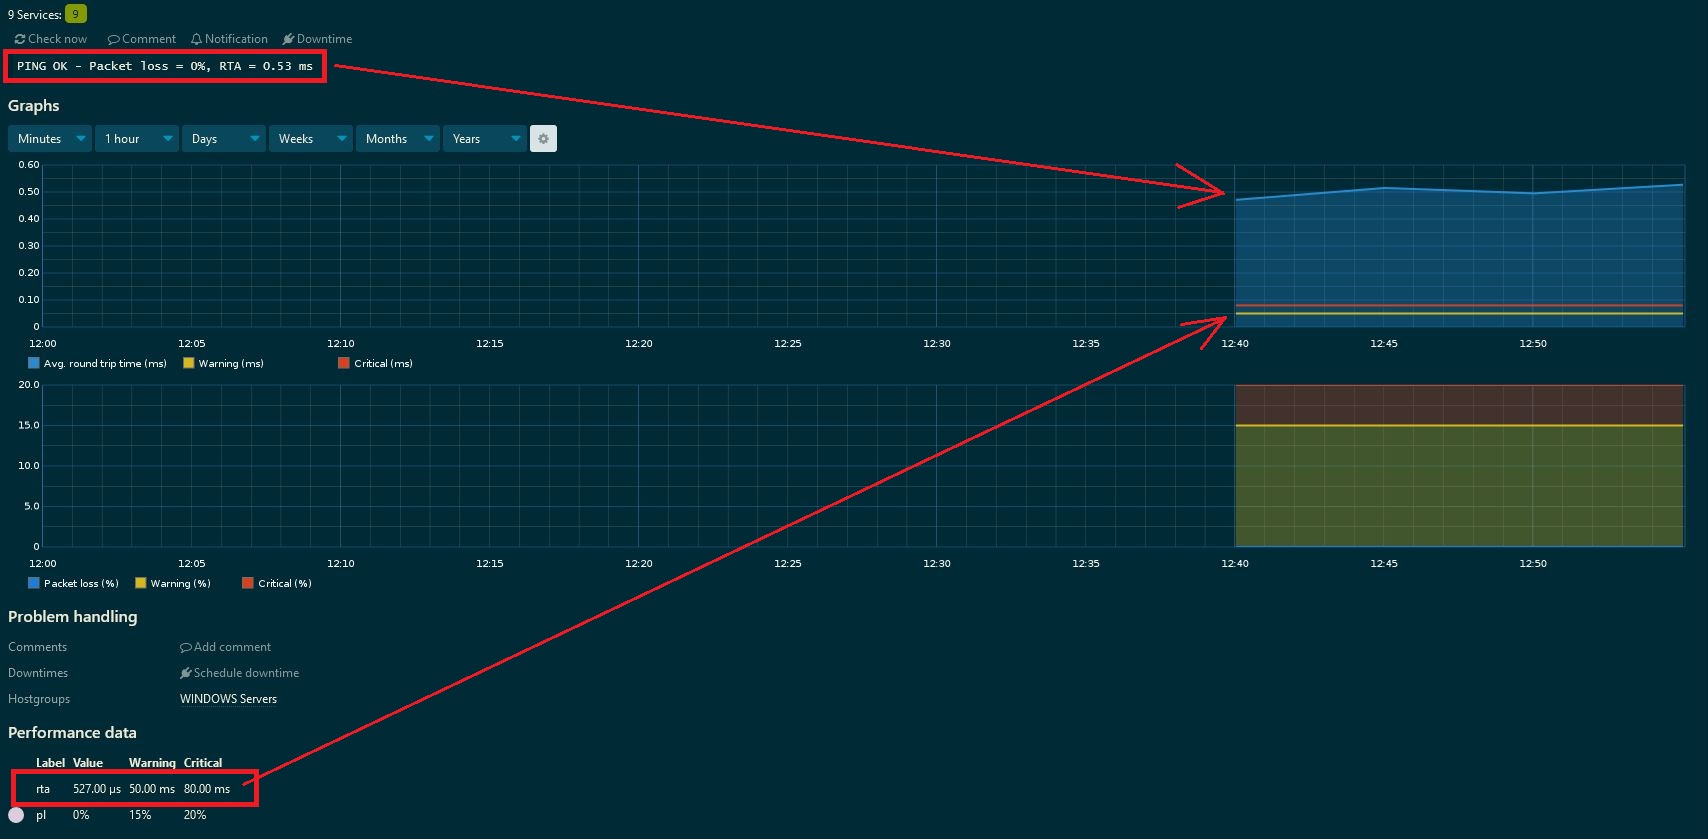
Hostalive plugin output shows 0.53 ms, this value appears fine in graph.
But Performance data shows 527 µs for the same value, and warning (50 ms) and critical (80 ms) values appear in this ratio, according to 527 value, doesn’t matter difference of units.
Why do I get performance data in µs? BTW Performance data value changes dinamically between µs and ms.
Because I can create hostalive / ping check command with warning and critical thresholds in ms unit, I’m not able to fix this issue from check command definition side.
I think this issue does not related to plugin output, because output is in ms unit.
How can I draw appropiate warning and critical lines to graph?
Here is my graph:
Thanks in advance for the help.
Gabor