Setup graphite and integrated it with Icinga, in general graphs have populated across our host and services (the icinga integration was especially easy to get up and running, thank you!), but we have some windows perfmon checks that are not graphing.
I mostly wanted to confirm this is a known issue, and its current status.
Are there any immediate work-arounds? I’ve setup a perfmon check that doens’t have a dot in it ( \PhysicalDisk(1 E:)\Disk Transfers/sec ) and am waiting for the new data point to populate.
It is known and discussed, but nothing worthy for a GH update.
A known workaround for perfdata key labels which do not conform the spec, is to define your own with perfmon_win_syntax. This borrows the idea from NSCP’s perf-syntax feature.
I’ve tried adding a perfmon_win_syntax after the fact, does this need to be done prior? Can i delete the data in graphite and let it repopulate with the new perfmon_win_syntax?
I also setup a perfmon service that does not have the dot in it and I am seeing the same issue, no graph is being displayed in both icinga and graphite.
For the second check, here is the command it is running:
‘C:\Program Files\ICINGA2/sbin/check_perfmon.exe’ ‘–fmt-countertype’ ‘double’ ‘-P’ ‘\PhysicalDisk(1 E:)\Disk Transfers/sec’
Look how graphite’s whispher works and either manually delete the wsp file on disk, or use a CLI command (AFAIK some exists). Others might know better.
Could also be a locale problem with or without UTF8. Which language is configured for this system?
Unclear to me how that would be the issue – the window servers are returning data and graphs from other stock requests, such as load, memory, disk-windows, but the perfmon checks are not rendering a graph. again, from the debug it seems to suggest there is data, and when i run whisper-fetch against the .wsp file I see data.
Can you provide any more information on next trouble shooting steps?
Can anyone in the community provide recommendations, does anyone have a working example of graphs being populated from check_perfmon.exe?
Here’s an section of output from whisper-fetch
1568643600 0.092614
1568643660 None
1568643720 None
1568643780 None
1568643840 None
1568643900 0.080489
1568643960 None
1568644020 None
1568644080 None
1568644140 None
1568644200 None
1568644260 None
1568644320 0.053848
1568644380 None
1568644440 None
1568644500 None
1568644560 0.077335
1568644620 None
1568644680 None
1568644740 None
1568644800 None
1568644860 0.046602
~
This is for a perfmon check, under inspect
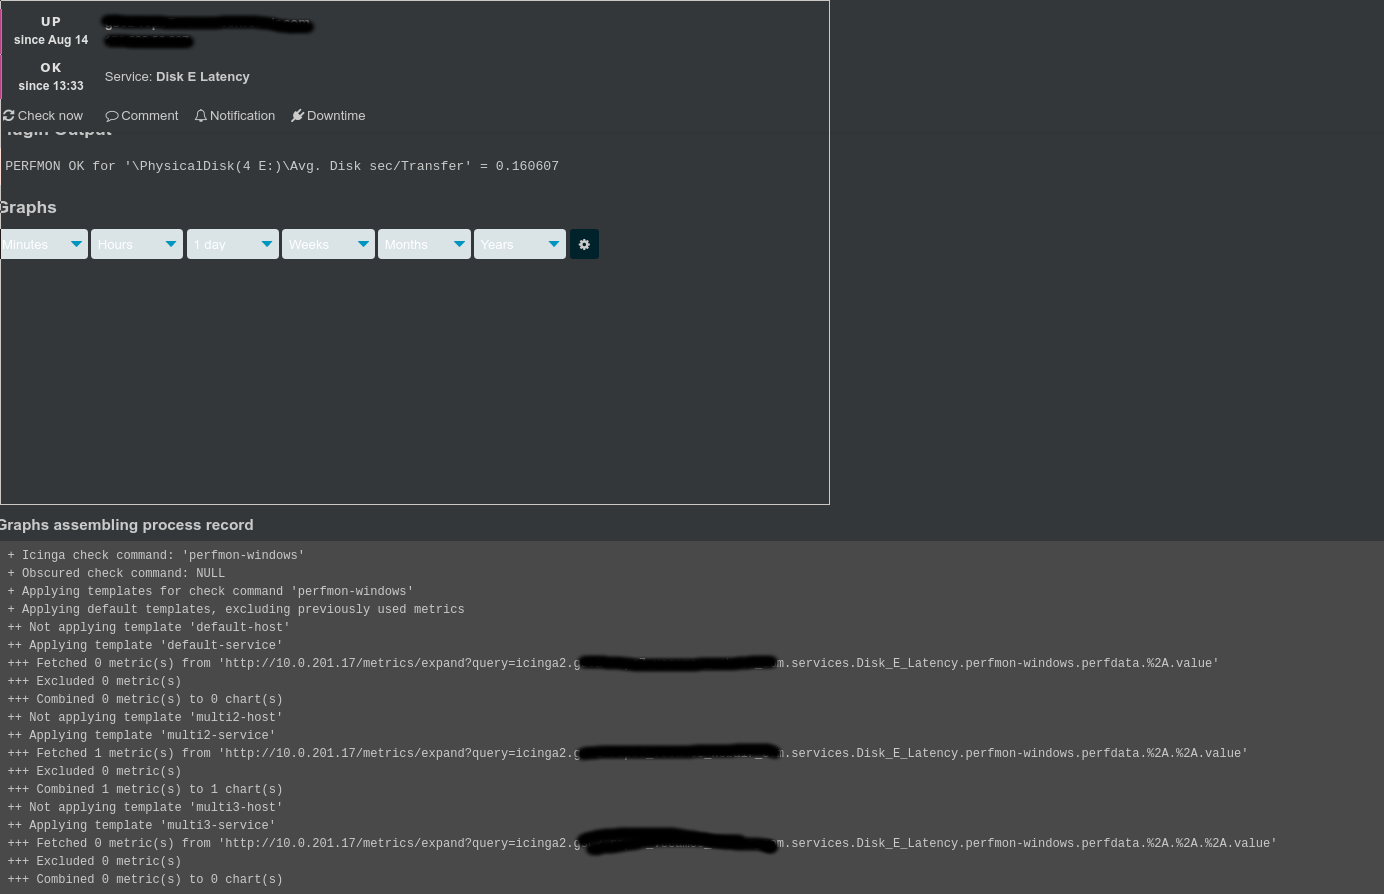
‘C:\Program Files\ICINGA2/sbin/check_perfmon.exe’ ‘–fmt-countertype’ ‘double’ ‘-P’ ‘\PhysicalDisk(4 E:)\Avg. Disk sec/Transfer’
a typical output:
PERFMON OK for ‘\PhysicalDisk(4 E:)\Avg. Disk sec/Transfer’ = 0.132673
~~
but where the graph should be is instead a black box of the same size. In graphite-web, when I pull this up, i get a ‘No Data’ display.
Are you running the most up to date version of the graphite module? Maybe do a fresh git clone from https://github.com/Icinga/icingaweb2-module-graphite, because there were some fixes for special characters in perfdata labels recently. Maybe this is all that is needed.
If not, check the path to the whisper files. Normally they should look like ... icinga2/<hostname>/<host or services>/<service name>/<check command>/perfdata/<perfdata label>/<.wsp files>
e.g. ...icinga2/st-win01-dev/services/windows-cpu-agent/load-windows/perfdata/load/value.wsp
This is also what the default template expects. If yours somehow differ from that (I think they do, because of the multiple %2A appearances in your screenshot), you will need to create a special template for those checks and force the module to use them by assigning the graphite_check_command override variable.
I tried some additional perfmon_win_syntax changes and can see graphs populating. Appears graphitedb has a number of special characters it does not like to parse.