Perfdatagraphinfluxdbv2 not displaying graph

Hi,

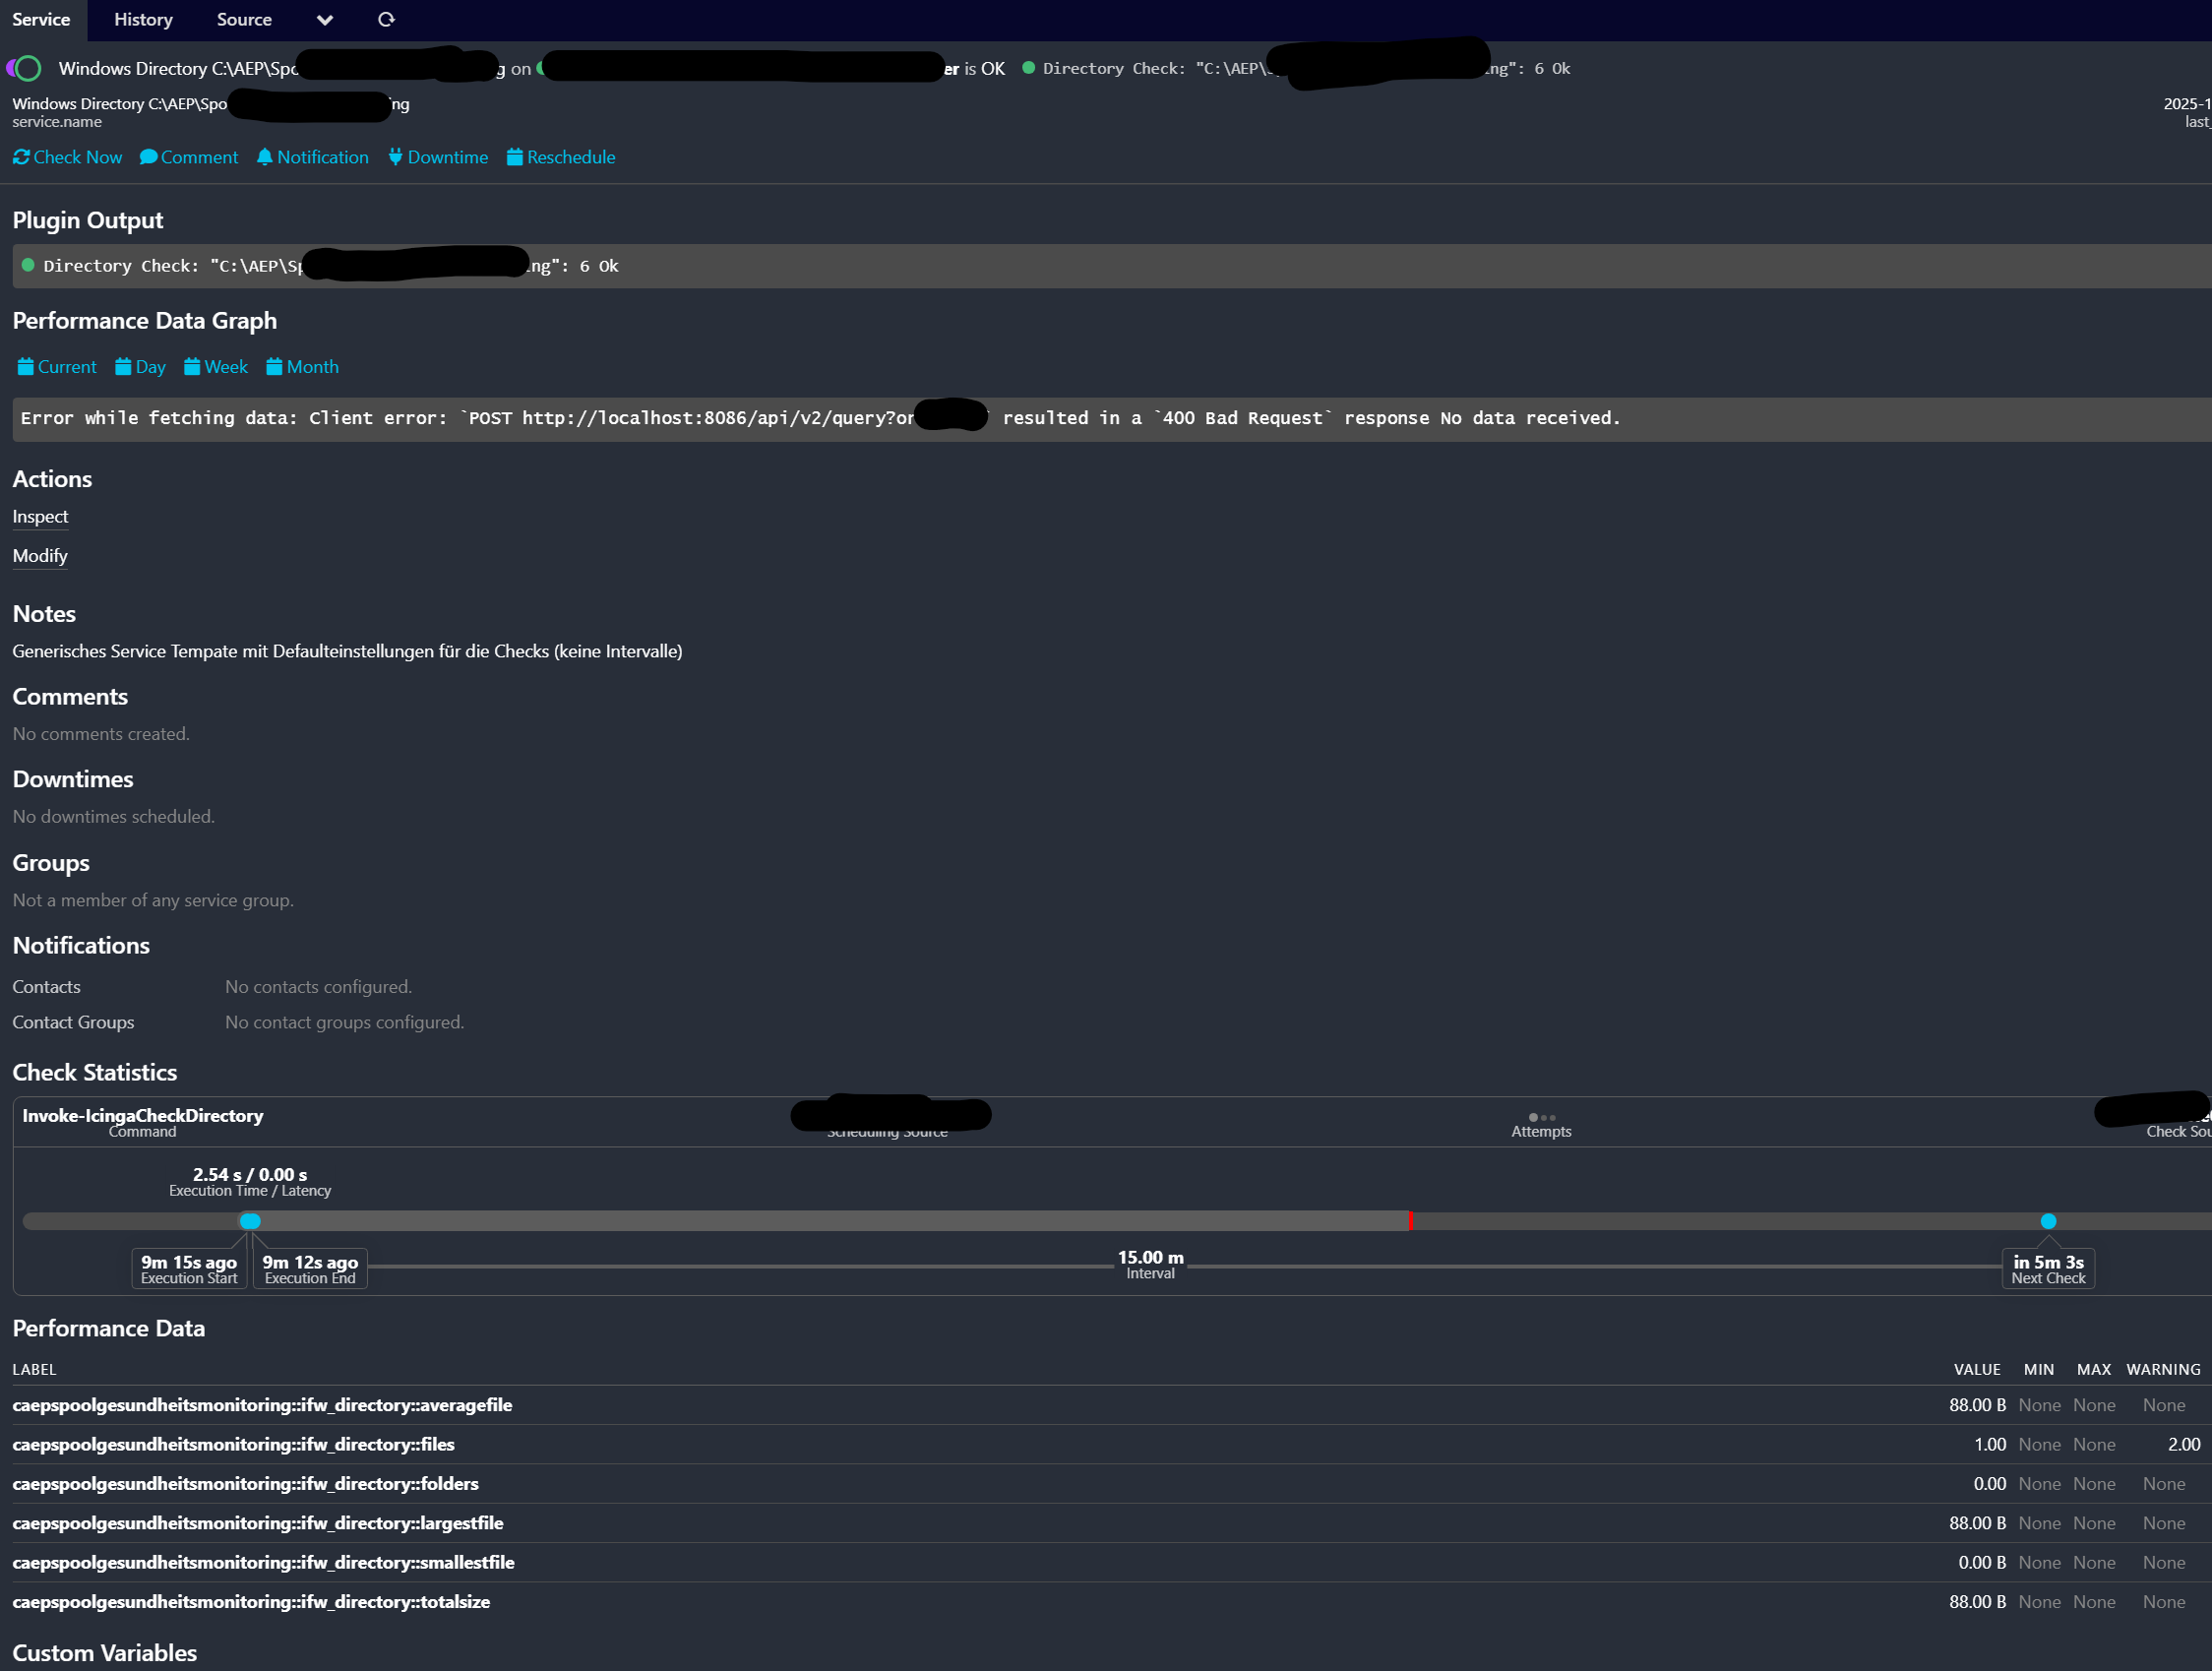
can anyone verify whether the perfdatagraph shows any graph for the Invoke-IcingaCheckDirectory Command? It works quite good for all checks except for the mentioned one. If I query the corresponding metrics in grafana it works as expected. So the request generated from the perdatagraphsinfludbv2-module must be somehow malformed?

Version:

current modules in use:

  • perfdatagraph v0.2.2
  • perfdatagraphsinfluxdbv2 v0.2.0

rpm -qa | grep icinga
icinga-director-daemon-1.11.5-1.el8.noarch
icinga-director-1.11.5-1.el8.noarch
icingadb-web-1.2.3-1.el8.noarch
icingadb-redis-7.2.12-1.el8.x86_64
icingaweb2-2.12.5-1.el8.noarch
icinga-selinux-common-1.0.0-1.el8.icinga.noarch
php-icinga-2.12.5-1.el8.noarch
icinga2-common-2.15.1-1.el8.x86_64
icinga-l10n-1.3.0-1.el8.noarch
icinga-director-php-1.11.5-1.el8.noarch
icinga2-bin-2.15.1-1.el8.x86_64
icinga-php-library-0.17.1-1.el8.noarch
icinga2-selinux-2.15.1-1.el8.x86_64
vim-icinga2-2.15.1-1.el8.x86_64
icinga-php-incubator-0.23.0-1.el8.noarch
icinga2-ido-mysql-2.15.1-1.el8.x86_64
icingaweb2-common-2.12.5-1.el8.noarch
icinga-director-web-1.11.5-1.el8.noarch
icinga-php-thirdparty-0.13.1-1.el8.noarch
icinga2-2.15.1-1.el8.x86_64
icingacli-2.12.5-1.el8.noarch
icingadb-1.4.0-4.el8.x86_64

Are you sure the connection between icingaweb2-module-perfdatagraphsinfluxdbv2 and InfluxDB2 is working properly?

yes all other checks(commands) provide clean graphs, only Invoke-IcingaCheckDirectory checks are showing the error in the Icinga-Graph-Panel.

Ahh, Aight. Can you find in InfluxDB2 any data for the corresponding perfdata Fields? Or maybe look into /var/log/icinga2.log
In some cases the influxdb2writer refuses to write some fields, in this case we would see a couple error messages.

I checked that already but I see no logs related to this request. I checked the influxdb logs icingaweb2 and icinga2 logs. I see logs when grafana is requesting the corresponding metrics from influxdb but this works as mentioned. I will try turning on the debug log in influxdb and will get back then. Maybe there I see more.

Thank you!

Just have been given a hint, you might want to enable Icingaweb2 Debug Logs and look at them afterwards: icingaweb2-module-perfdatagraphs/doc/70-Troubleshooting.md at main · NETWAYS/icingaweb2-module-perfdatagraphs · GitHub

OK thank you this is the output. Here the logs from the Service which does not provide a graph:

2025-11-28T15:51:29+01:00 - DEBUG - Used IcingaDB as database backend
2025-11-28T15:51:29+01:00 - DEBUG - Loaded Perfdata Graphs module configuration to get Hook
2025-11-28T15:51:29+01:00 - DEBUG - Loaded Perfdata Graphs InfluxDBv2 module configuration to get Config
2025-11-28T15:51:29+01:00 - DEBUG - Calling query API at ``http://localhost:8086/api/v2/query`` with count query: {“stream”:true,“headers”:{“Authorization”:“Token ”,“Content-Type”:“application/json”,“Accept”:“application/csv”},“query”:{“org”:“”},“json”:{“query”:“from(bucket: "icinga/default")|> range(start: 1764298289)|> filter(fn: (r) => r._measurement == "Invoke-IcingaCheckDirectory")|> filter(fn: (r) => r["hostname"] == "example.local")|> filter(fn: (r) => r["service"] == "Windows Directory C:\AEP\Spool\test")|> count()”,“type”:“flux”,“dialect”:{“header”:true,“delimiter”:“,”,“annotations”:[“datatype”,“group”,“default”],“commentPrefix”:“#”}}}
2025-11-28T15:51:39+01:00 - DEBUG - Loaded Perfdata Graphs module configuration to get Config
2025-11-28T15:51:39+01:00 - DEBUG - Found no data in cache for c3ZpZTAxMjMudmllMDEubG9jYWxXaW5kb3dzIERpcmVjdG9yeSAgQzpcQUVQXFNwb29sXEdlc3VuZGhlaXRzbW9uaXRvcmluZ0ludm9rZS1JY2luZ2FDaGVja0RpcmVjdG9yeVBUMTJIZmFsc2U=
2025-11-28T15:51:39+01:00 - DEBUG - Used IcingaDB as database backend

And here a request with a working Perfdatagraph as comparison:
2025-11-28T15:57:23+01:00 - DEBUG - Calling query API at ``http://localhost:8086/api/v2/query`` with query: {“stream”:true,“headers”:{“Authorization”:“Token <TOKEN>”,“Content-Type”:“application/json”,“Accept”:“application/csv”},“query”:{“org”:“<ORG>”},“json”:{“query”:“from(bucket: "icinga/default")|> range(start: 1764298643)|> filter(fn: (r) => r._measurement == "uptime-windows")|> filter(fn: (r) => r["hostname"] == "example.local")|> filter(fn: (r) => r["service"] == "Uptime")|> map(fn: (r) => ({r with warn: if exists r.warn then r.warn else "", crit: if exists r.crit then r.crit else ""}))|> pivot(rowKey:["_time"], columnKey: ["_field"], valueColumn: "_value")|> sort(columns: ["_time"])|> keep(columns: ["_time", "value", "warn", "crit", "unit", "host", "service", "metric"])”,“type”:“flux”,“dialect”:{“header”:true,“delimiter”:“,”,“annotations”:[“datatype”,“group”,“default”],“commentPrefix”:“#”}}}

Can you maybe create the same check Invoke-IcingaCheckDirectory and verify if the graph is working for you in this case?

Another thing…I played around with some other checks and noticed that the perfdatagraph has especially problems with checks which store multiple metrics (6+). When I extend the time-range to a week it stops working:
Error while fetching data: Connection refused for URI http://localhost:8086/api/v2/query?org=xy No data received.

Congrats, you discovered a bug. [Bug]: Query builder should escape special characters · Issue #27 · NETWAYS/icingaweb2-module-perfdatagraphs-influxdbv2 · GitHub

We’ll try to fix soon.

3 Likes

This should fix the issue Fix escaping in queries by martialblog · Pull Request #29 · NETWAYS/icingaweb2-module-perfdatagraphs-influxdbv2 · GitHub