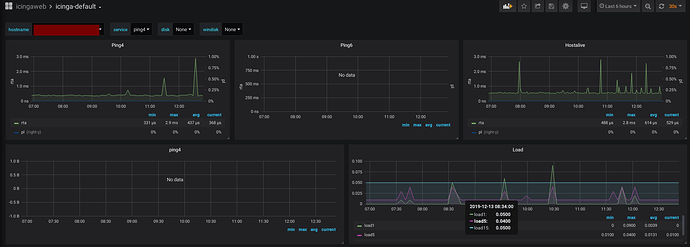
Graphite veteran with a grass is greener complex I guess. I’m running into some quirks with the Icingaweb integration for Grafana/InfluxDB that seems quirkier than what I’ve come across googling.
So, to start off here, this is what I get if I query Influx for Ping4 with a capital P versus ping4 with a lowercase p:
> select * from Ping4 where hostname = 'myhostnamewashere' and time > '2019-12-13T12:16:34Z'
> select * from ping4 where hostname = 'myhostnamewashere' and time > '2019-12-13T17:34:46Z'
name: ping4
time                 hostname                     metric service unit    value
----                 --------                     ------ ------- ----    -----
2019-12-13T17:39:47Z myhostnamewashere pl     ping4   percent 0
2019-12-13T17:39:47Z myhostnamewashere rta    ping4   seconds 0.000339
2019-12-13T17:44:47Z myhostnamewashere pl     ping4   percent 0
2019-12-13T17:44:47Z myhostnamewashere rta    ping4   seconds 0.000388
>
So here we have Icinga using the literal name of the check. This is what I expect.
What I’m getting is that the default metrics assoicated with the base-metrics.json supplied with the web module (Ping4/Ping6/Hostalive) are showing metrics, but if I select one of these datapoints from the list, the 2nd pane down which is supposed to display this metric returns no datapoints. I tested this on both Grafana 6.5.2 and 4.2.0 since I’ve read there was a considerable change in functionality with 5. Here’s what it looks like:
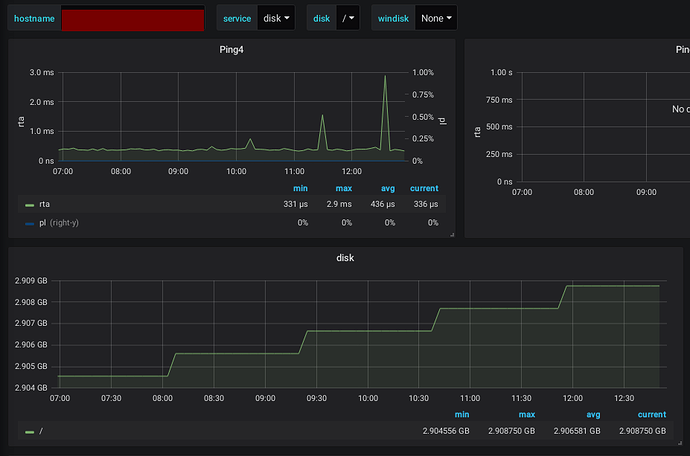
Now we also have some variables to pick from at the top. If I select a value for disk and the disk check, this one will provide a datapoint:
I’m thinking either I’m a bonehead missing something totally obvious in the config; or the variables above are throwing things off; or something with that imported dashboard just isn’t supporting what I have icinga dumping in there.
Anyone seen this before?
Thanks,
-Blake


