Hello ![]()
I have a setup with about 800 hosts and few thousands services and normally everything works fine with my graphs…except one graph with the interface usage of one server.
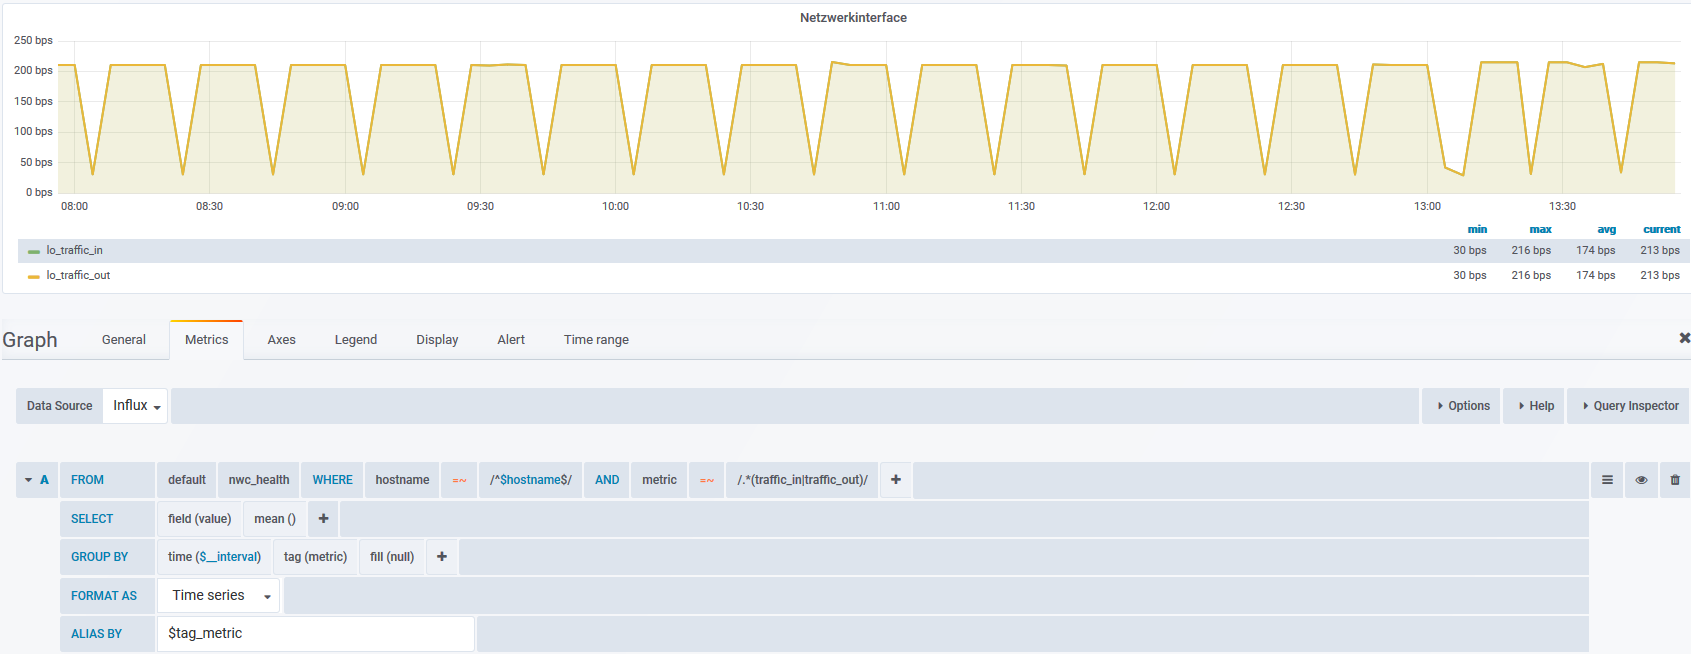
I monitor the interface usage form my linux servers with ‘check_nwc_health’. The server which I monitor got an upgrade from Ubuntu 18.04 to Ubuntu 19.10, with 18.04 I had no problems (And the other servers which got an upgrade are still working fine). But after the upgrade I only see the the ‘lo’ interfaces. Even if i check the stored series in the InfluxDB I am not able to find the data, so it should be a problem between Icinga2(‘check_nwc_health’) and InfluxDB and not with graphana… at least this is my best guess
My graph:
If I execute the check manually on the bash I got the following output
root@IcingaServer:~# ‘/usr/lib/nagios/plugins/check_nwc_health’ ‘–community’ ‘xxxx’ ‘–hostname’ ‘XXX.XXX.XXX.XXX’ ‘–mode’ ‘interface-usage’
OK - interface lo usage is in:0.02% (2215.60bit/s) out:0.02% (2215.60bit/s), interface Broadcom Inc. and subsidiaries NetXtreme BCM5720 2-port Gigabit Ethernet PCIe 2 (alias eno1) usage is in:0.73% (7293016.80bit/s) out:1.26% (12568806.80bit/s), interface Broadcom Inc. and subsidiaries NetXtreme BCM5720 2-port Gigabit Ethernet PCIe 3 (alias eno2) usage is in:0.00% (0.00bit/s) out:0.00% (0.00bit/s) (down) | ‘lo_usage_in’=0.02%;80;90;0;100 ‘lo_usage_out’=0.02%;80;90;0;100 ‘lo_traffic_in’=2215.60;8000000;9000000;0;10000000 ‘lo_traffic_out’=2215.60;8000000;9000000;0;10000000 ‘Broadcom Inc. and subsidiaries NetXtreme BCM5720 2-port Gigabit Ethernet PCIe 2_usage_in’=0.73%;80;90;0;100 ‘Broadcom Inc. and subsidiaries NetXtreme BCM5720 2-port Gigabit Ethernet PCIe 2_usage_out’=1.26%;80;90;0;100 ‘Broadcom Inc. and subsidiaries NetXtreme BCM5720 2-port Gigabit Ethernet PCIe 2_traffic_in’=7293016.80;800000000;900000000;0;1000000000 ‘Broadcom Inc. and subsidiaries NetXtreme BCM5720 2-port Gigabit Ethernet PCIe 2_traffic_out’=12568806.80;800000000;900000000;0;1000000000 ‘Broadcom Inc. and subsidiaries NetXtreme BCM5720 2-port Gigabit Ethernet PCIe 3_usage_in’=0%;80;90;0;100 ‘Broadcom Inc. and subsidiaries NetXtreme BCM5720 2-port Gigabit Ethernet PCIe 3_usage_out’=0%;80;90;0;100 ‘Broadcom Inc. and subsidiaries NetXtreme BCM5720 2-port Gigabit Ethernet PCIe 3_traffic_in’=0;0;0;0;0 ‘Broadcom Inc. and subsidiaries NetXtreme BCM5720 2-port Gigabit Ethernet PCIe 3_traffic_out’=0;0;0;0;0
I do not find any mistakes there, the perfdata looks correct for me…or do I miss something?
I hope someone has a idea where the problem is… If you need more data, pls ask and say what exactly you need. ![]()
 The name was too long. All our server are just show this kind of interface names and not the linux names for it.