ok -
i’ve already read other posts about similar probs (like Director Notifications.conf).
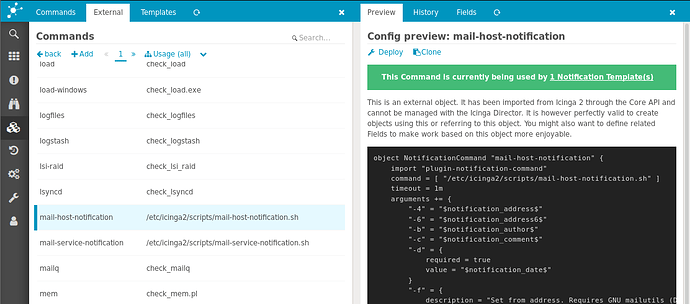
The ‘commands.conf’ is available to director: /etc/icinga2/conf.d/ contains api-users.conf and commands.conf only.
i’ve exchanged ‘hostalive’ for ‘ping4’ - since mostly i want to try to start simple (check host UP/Down and notify acc. …) - no change in the result.
After enabling ‘debug-mode’ (# icinga2 feature enable debuglog) the following is shown after ‘host-DOWN’ event:
...
[2019-10-17 07:58:00 +0200] information/Checkable: Checkable 'testing_dev' has 1 notification(s). Checking filters for type 'Problem', sends will be logged.
[2019-10-17 07:58:00 +0200] notice/Notification: Attempting to send notifications of type 'Problem' for notification object 'testing_dev!host_notification_rule'.
[2019-10-17 07:58:00 +0200] notice/ApiListener: Relaying 'event::SendNotifications' message
[2019-10-17 07:58:00 +0200] notice/Notification: Not sending notifications for notification object 'testing_dev!host_notification_rule': after specified end time (less than 1 millisecond)
[2019-10-17 07:58:00 +0200] notice/ApiListener: Relaying 'event::SetForceNextNotification' message
[2019-10-17 07:58:00 +0200] debug/IdoMysqlConnection: Query: UPDATE icinga_hoststatus SET acknowledgement_type = '0',  active_checks_enabled = '1',  check_command = 'hostalive',  check_source = 'master.xxx.yyy',  check_timeperiod_object_id = 312,  check_type = '0',  current_check_attempt = '1',  current_notification_number = '0',  current_state = '1',  endpoint_object_id = 246,  event_handler_enabled = '1',  execution_time = '3.070907',  flap_detection_enabled = '1',  has_been_checked = '1',  host_object_id = 318,  instance_id = 1,  is_flapping = '0',  is_reachable = '1',  last_check = FROM_UNIXTIME(1571291880),  last_hard_state = '1',  last_hard_state_change = FROM_UNIXTIME(1571291880),  last_notification = FROM_UNIXTIME(1571290866),  last_state_change = FROM_UNIXTIME(1571291759),  last_time_down = FROM_UNIXTIME(1571291880),  last_time_up = FROM_UNIXTIME(1571291456),  latency = '0.001303',  long_output = '',  max_check_attempts = '3',  next_check = FROM_UNIXTIME(1571292171),  next_notification = FROM_UNIXTIME(1571292341),  normal_check_interval = '5',  notifications_enabled = '1',  original_attributes = 'null',  output = 'CRITICAL - Host Unreachable (10.0.0.99)',  passive_checks_enabled = '1',  percent_state_change = '15.700000',  perfdata = '',  problem_has_been_acknowledged = '0',  process_performance_data = '1',  retry_check_interval = '1',  scheduled_downtime_depth = '0',  should_be_scheduled = '1',  state_type = '1',  status_update_time = FROM_UNIXTIME(1571291880) WHERE host_object_id = 318
...
So it looks like a timing-problem?!
Best regards, sg
