Not sending out notifications

So I used stress on a vm connected to the master node running icinga to force the node into a crtical state for cpu usage

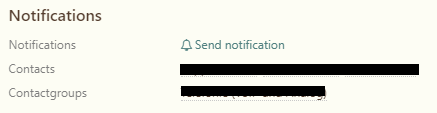
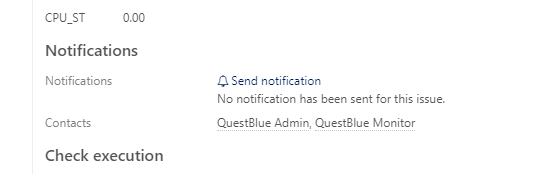
I waited about 30 mins and have not received a notification, It says below notification No notification has been sent for this issue.

Here are my configurations

notifications.conf

apply Notification "notify-once" to Service{
    import "mail-service-notification"

    users = [ "monitor" , "admin" ]
    interval = 5m

    assign where service.name == "Ping"
}

I have repeated this in the same file for every service

users.conf

object User "admin"{
    import "generic-user"
    display_name = "<removed for security purposes> Admin"
    enable_notifications = true
    states = [ Warning, Critical, Unknown ]
    types = [ Problem, Acknowledgement, Recovery, Custom, FlappingStart,
        FlappingEnd, DowntimeStart, DowntimeEnd, DowntimeRemoved ]
    email = "<removed for security purposes>"
}

I am not sure where to go from here in order to get notifications work. I know that the mail server is working correctly because I can go to the notifications tab and send out a custom message but it is not automatically sending the notifications.

Please advise on where I should go from here

users = [ "monitor", "admin" ] kill the blank

Please share your service config. Maybe no period is set.

Here is a snippet from my services.conf

// Ping Check
apply Service "Ping" {
    import "generic-service"
    check_command = "ping4"
    check_interval = 5m
    retry_interval = 10m
    assign where host.address // check is executed on the master node
}

// System Load
apply Service "System Load" {
    import "generic-service"
    check_command = "load"
    check_interval = 5m
    retry_interval = 10m
    command_endpoint = host.vars.client_endpoint // Check executed on client node
    assign where host.vars.client_endpoint
}

// System Process Count
apply Service "Process" {
    import "generic-service"
    check_command = "procs"
    check_interval = 5m
    retry_interval = 10m
    command_endpoint = host.vars.client_endpoint
    assign where host.vars.client_endpoint
}

I miss a timeperiod in your config.

https://icinga.com/docs/icinga2/latest/doc/08-advanced-topics/#time-periods

You need a period for your notification; services; hosts

https://icinga.com/docs/icinga2/latest/doc/04-configuration/#templatesconf

Example:

template Notification "host-24x7" {
  interval = 6h  

  command = "mail-host-notification"
  states = [ Up, Down ]
  types = [ Problem, Acknowledgement, Recovery, Custom,
                        FlappingStart, FlappingEnd,
                        DowntimeStart, DowntimeEnd, DowntimeRemoved ]
  period = "24x7"
}

apply Notification "mail-host-24x7" to Host {
  import "host-24x7"

  user_groups = host.vars.notification.mail.groups
  users = host.vars.notification.mail.users

  if ( host.vars.notification_interval ) {
	interval = host.vars.notification_interval
    }

  assign where host.vars.sla == "24x7" && host.vars.notification.mail
  ignore where host.vars.sla == "never"
}

object TimePeriod "24x7" {
  display_name = "Rund um die Uhr"
  ranges = {
        "monday"        = "00:00-24:00"
        "tuesday"       = "00:00-24:00"
        "wednesday"     = "00:00-24:00"
        "thursday"      = "00:00-24:00"
        "friday"        = "00:00-24:00"
        "saturday"      = "00:00-24:00"
        "sunday"        = "00:00-24:00"
  }
}

apply Service "storage-root" {
	import "generic-service"
	check_command = "check-snmp-storage"
	icon_image =    "custom/hdd.png"
	vars.storage = "/"
	vars.warn = "90"
	vars.crit = "95"

	vars.sla = "24x7" // *or vars.sla = host.vars.sla*

	assign where host.address && host.vars.os == "linux" 
	ignore where host.vars.storage == false
}

Check your Icingaweb 2 --> service details --> Notifications

I suspect there is no contact deposited.

tempsnip

eef

I setup the timeperiod object and put the period into my conf file like in your example

And it does have the contacts there

What does the icinga2.log say around the time the notification should have been sent?
Please also show the config of the notification template.
Also, if you really want to receive the recovery notifications the “OK” state is missing in your user configuration.

small hint: the flag “icinga web 2” for this topic doesn’t fit, “icinga 2” would be better.

1 Like

Where would the icinga2 log be?(I am using Centos7)

This is in my templates.conf for mail-service-notification

template Notification "mail-service-notification" {
command = "mail-service-notification"

states = [ OK, Warning, Critical, Unknown ]
types = [ Problem, Acknowledgement, Recovery, Custom,
        FlappingStart, FlappingEnd,
        DowntimeStart, DowntimeEnd, DowntimeRemoved ]

vars += {
// notification_icingaweb2url = "https://www.example.com/icingaweb2"
// notification_from = "Icinga 2 Service Monitoring <icinga@example.com>"
notification_logtosyslog = false
}
period = "24x7"
}

hi, the log file is /var/log/icinga2/icinga2.log.

There is no log file there

Here are the features list

Disabled features: compatlog debuglog elasticsearch gelf graphite livestatus opentsdb perfdata syslog

Enabled features: api checker command ido-mysql influxdb mainlog notification statusdata

Normally the Directory should look like this:
image

You could try to turn on the debuglog Feature. Then you’ll get also a file “debug.log” in this directory with much more Information. But don’t forget to turn this feature off after you finish debugging. Because this file is growing very fast, depending on your configuration.

Hey Stevie,

I found the log files(was originally looking in /etc not /var)

The log file was enormous so I erased the entire thing and then put my vm in critical state and still no notification and no additional logs

I also turned on the debuglog and also got nothing in there

Thanks Joseph

is your host reaching the hard state before you expect a notification? If i’m correctly with check_interval und retry_interval your host should arrive the hard state after 30-35 min! So after this time Icinga sends with your configuration the notification if the hosts arrives that state. The Default value for max_check_attempt is 3. For testing you can set the max_check_attempt option to 1 and the retry interval to 1m. So should get an the notification earlier.

if you have the icinga2 book, there is a very good Explanation about notification incl. a graph.

1 Like

Hey Stevie,

I changed the max_check_attempt to 1 and retested and still no notification being sent

Thanks Joseph

Look into your Icingaweb2 --> System --> Monitoring Health:

Did you enable the Notifications?

Unbenannt

1 Like

What do you mean by this?
Are there literally no lines at all in both logs?
Check the log around the time the notification should be sent for lines like

information/Checkable: Checking for configured notifications for object
-and/or-
notice/Notification: Attempting to send  notifications for notification object ....
-and/or-
notice/Notification: Not sending  notifications for notification object.... 

You can also check some variables on the service object via the API:
https://localhost:5665/v1/objects/notifications?filter=match("<service_name>", service.name)

Output looks something like this:

{
"attrs":
{
"__name":"<hostname>!<service_name>!<notification_name>",
"active":true,
"command":"alarm-service_autoticket",
"command_endpoint":"",
"ha_mode":0.0,
"host_name":"<hostname>",
"interval":0.0,
"last_notification":1513774196.1616489887,
"last_problem_notification":1513774196.1616489887,
"name":"<notification_name>",
"next_notification":1515498467.2694029808,
"no_more_notifications":true,
"notification_number":0.0,
"notified_problem_users":["Autoticket-Intern"],
"original_attributes":null,
"package":"director",
"paused":false,
"period":"Always",
"service_name":"<service_name>",
"source_location":{"first_column":1.0,
"first_line":485.0,
"last_column":79.0,
"last_line":485.0,
"path":"/var/lib/icinga2/api/packages/director/something-1515418089-16/zones.d/something/notification_apply.conf"},
"states":["Critical"],
"templates":["<notification_name>",
"generic-service-alarm_autoticket",
"generic-service-alarm"],
"times":{"begin":3600.0},
"type":"Notification",
"types":["Problem"],
"user_groups":null,
"users":["Autoticket-Intern"],
"vars":null,
"version":0.0,
"zone":"something"
},
"joins":{},
"meta":{},
"name":"<hostname>!<service_name>!<notification_name>",
"type":"Notification"
}
]
}

Check the variables last_notification, last_problem_notification, next_notification, no_more_notifications, notification_number, notified_problem_users

1 Like

Yea Notifications are on

icinga

If I delete the file and then put my vm in crtitical mode(over 80% cpu usage) there are no additional logs that are put in icinga2.log the only time I see it atually put new logs is on restart

I took again a look to your Notification rule. I don’t see a Notification Command. You could also check this again. Also the Definition of your command. Here you can check if you can manually run the notification script.

If this is correct, i think it’s time for the debug log.
And maybe you should also ask your mail admin if he see something in his logs, if the mail server is receiving something from your icinga server.

1 Like

No need to bother the mail admin, on CentOS with the default postfix mta each sent mail is recorded in /var/log/maillog :wink:

Another possible source of failure if you have a HA-setup: make sure that both master servers have the notification feature enabled. I had that problem a while ago, master1 didn’t care about notifications for a specific service and master2 had them turned off -> nothing was sent out.

I checked the maillog and I can entries hit the maillog if I send the notification manually. But if I am waiting for it to send automatically it never hits the maillog

Also for testing I enabled the notification feature on the vm

And this is not a HA setup it is a master server with several client servers