Here’s the translation:
Hello everyone, Can anyone explain to me why the check ‘Invoke-IcingaCheckUsedPartitionSpace’ in my Icinga Web is not showing any performance graphs? All other checks are working fine. The whisper *.wsp files are being created. Via the Graphite browser I can see the diagrams.
Where can I start troubleshooting?
Thank you very much for your help
Stefan
cstein
June 30, 2026, 12:04pm
2
Hello
Thank you for your message. Could you please share the output of the plugin call on the PowerShell itself and a screenshot of the performance data panel of Icinga Web?
Hello ,
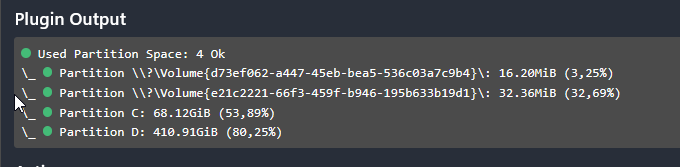
Here is the output of the Powershell command.
C:\Users\administrator.XXX> Invoke-IcingaCheckUsedPartitionSpace -v2
and the screenshot
Thank You
Kind regards
Stefan
rivad
June 30, 2026, 1:01pm
4
Is process performance data activated for this service?
Yes, i think so
IcingaCheckUsedPartitionSpace_Switchparameter_NoPerfData false
here the hole command
'C:\Windows\System32\WindowsPowerShell\v1.0\powershell.exe' '-NoProfile' '-NoLogo' '-ExecutionPolicy' 'ByPass' '-C' 'try { Use-Icinga -Minimal; } catch { Write-Output '\''The Icinga PowerShell Framework is either not installed on the system or not configured properly. Please check https://icinga.com/docs/windows for further details'\''; Write-Output '\''Error:'\'' $($_.Exception.Message)Components:`r`n$( Get-Module -ListAvailable '\''icinga-powershell-*'\'' )`r`n'\''Module-Path:'\''`r`n$($Env:PSModulePath); exit 3; }; Exit-IcingaExecutePlugin -Command '\''Invoke-IcingaCheckUsedPartitionSpace'\'' ' '-Warning' '90%' '-Critical' '95%' '-Include' '@()' '-Exclude' '@()' '-Verbosity' '2' '-CheckUsedSpace' '-NoPerfData'
rivad
June 30, 2026, 1:41pm
6
Not on the check plugin but on the icinga2 service that calls the check.
rivad
June 30, 2026, 1:42pm
7
If you use IcingaDB, you should see enable_perfdata true in the source tab of the service in icingaweb2.
Do you mean this one?
template Service “Invoke-IcingaCheckUsedPartitionSpace” {enable_perfdata = true `\\? ’” ]
rivad
June 30, 2026, 2:10pm
9
Now the question is, how you write into a time series DB and how you get the graph into the icingaweb2 page of the service.
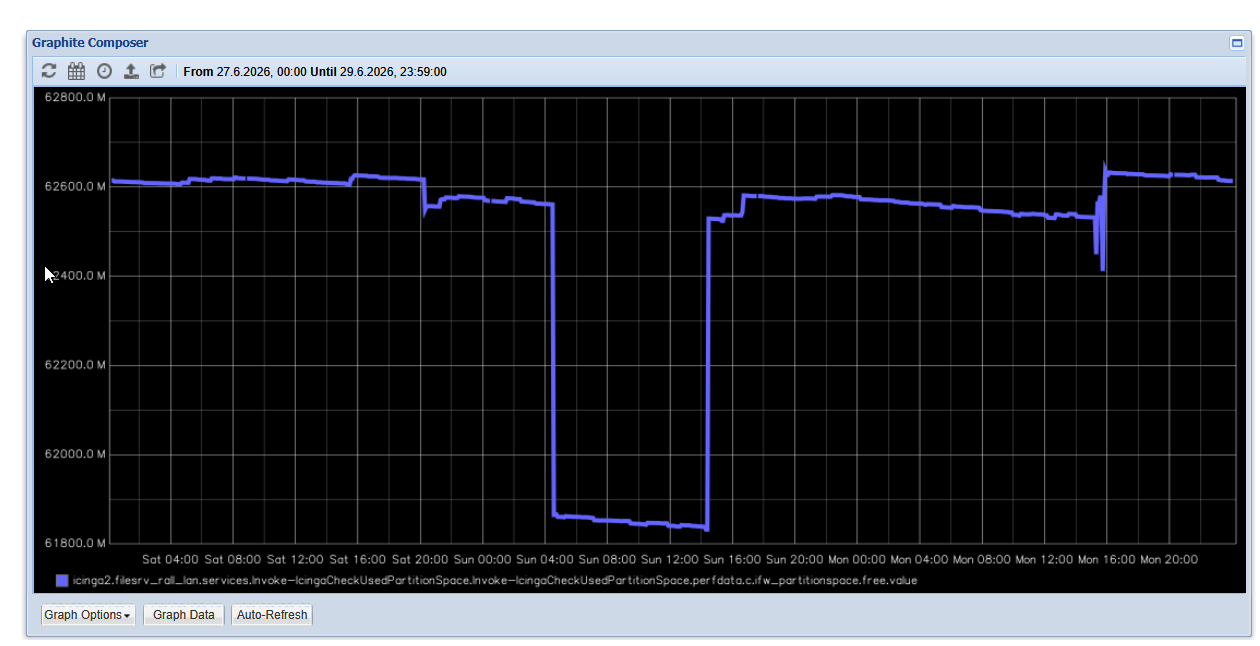
Strangely enough, I see the digagrams in the “graphite composer”.
Thank you for your effort
Stefan