Can you check Graphite directly or look in the whisper folder to see if you can find wsp files for those metrics? Not sure if its a problem on the Icinga, Graphite or Carbon side.
Also, are you using multiple carbon-cache daemons? A config error can cause some metrics to get lost but others to appear just fine.
White/blacklisting ist not enabled. Only one carbon-cache daemon.
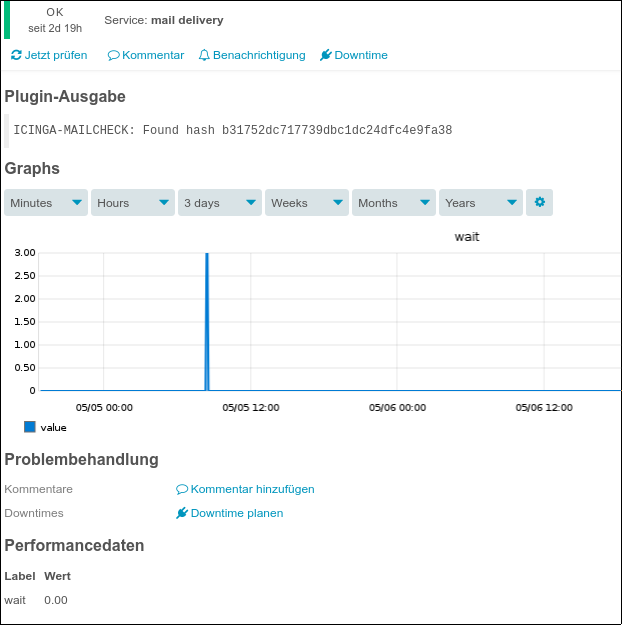
But there are actually no whisper files. This encouraged me to restart the carbon-cache daemon (was running for 7 days) and … … suspense … … graphs are created again!
So it had nothing to do with icinga.
Sorry for the noise and thanks a lot for your quick help!
ciberandy
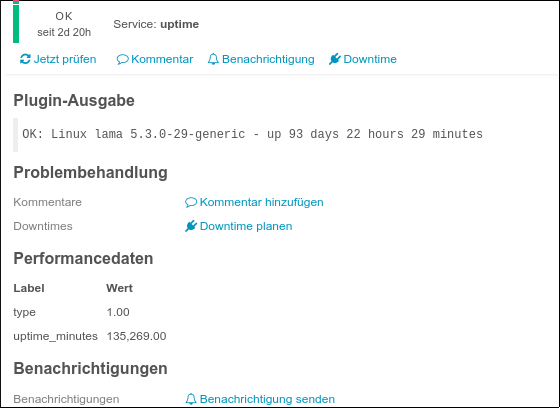
I had the same issue - I have created a new service in Icinga, but no Graph was displayed for it.
When I added “&graph_debug=1” to Icinga url, I have seen log message that 0 metrics was fetched.
I have opened the Graphite UI at http://localhost:4322/ and found graphs for other services, but the new one was not here too.
Then have I found hint here: retention in /etc/carbon/storage-schemas.conf should be aligned with the check_interval of the service, otherwise Graphite does not aggregate metrics correctly sometime - I have changed the check_interval to “1m” as the retention period in carbon and it works now