I am new to Icinga and was looking for some opensource monitoring solution for monitoring our VMWare Infrastructure and other physical infrastructure(linux and windows servers, switches, routers).
So far have been able to get the installation done properly without any issues… Am able to install the vSphere module and currently seeing all the inventory in the Virtualization(VMWare) panel.
Is it correct that Icinga is a point in time monitoring solution and for me to store and analyze the performance metrics, I need InfluxDB for this and the grafana to show the graphs. I tried enabling grafana module and influxdb feature. I could not succeed for some reason which I am still troubleshooting followed this link for the same Integrating Grafana into Icinga - DevOps - Enough
After seeing my inventory in the Virtualization panel, should I do the adding of the hosts again? Is there an easy way to do this?
I am assuming that I need not install agents on the Virtual machines. Can you please confirm.
Can you point me to the doc for enabling slack notifications
Yes, that is correct. To make use of the performance data and have a history of them you need some form of storage for them (InfluxDB, graphite) as well as a tool for visualisation (grafana, graphite).
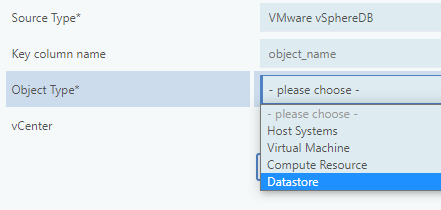
The module “Icinga Director” has an Import&Sync feature, were you can query various systems (like APIs or SQL db) to get objects that you then can sync into the Icinga Director. This will then generate a configuration for for Icinga 2.
The vSpehreDB module you already have running extends the Director by another import source: your vCenter. This way you can import host/vms/…
Not necessarily, no.
You can also monitor via SSH, SNMP, API. Basically “whatever” your endpoint/client provides and you(or someone) are willing to create a script to query it.
Every check in Icinga is a script that is executed to run some commands and report them back with a status code and some output (same basic concept as Nagios)
Notifications are also script based. Meaning: You need a notification command that is able to send slack notifications (however that works).
Thanks @log1c. Will review the documentation again. I did see the import feature and tried importing from vspheredb and now stuck at creating a sync_rule. Will go through the documentation and get back after understanding. Since am new to both Nagios and Icinga, seems to be a steep learning curve but the tool looks promising with lot of features/ customizations.