Hi,
I am using the latest icinga2 and icingaweb2 at ubuntu 20.04 LTS. I´ve set up a speed test service with centreon plugins:
object CheckCommand "centreon-speedtest" {
   import "plugin-check-command"

   command = [ "/home/nagios/centreon-plugins/centreon_plugins.pl" ]
   arguments = {
        "--plugin" = "apps::monitoring::speedtest::plugin"
        "--mode" = "internet-bandwidth"
        "--warning-bandwidth-download" = "$warn_download$"
        "--critical-bandwidth-download" = "$crit_download$"
        "--warning-bandwidth-upload" = "$warn_upload$"
        "--critical-bandwidth-upload" = "$crit_upload$"
        "--range-perfdata" = "1"
        "--filter-uom" = "ms"
        }
}
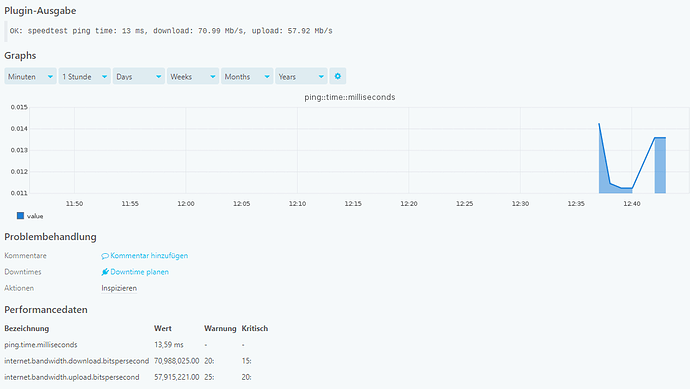
This service check has generated a single graphite graph for the ping time, but not for upload or download speed, although the perfdata values look fine:
perl centreon_plugins.pl --plugin=apps::monitoring::speedtest::plugin --mode=internet-bandwidth --filter-uom=ms
OK: speedtest ping time: 12 ms, download: 70.38 Mb/s, upload: 59.74 Mb/s | 'ping.time.milliseconds'=12.738ms;;;0; 'internet.bandwidth.download.bitspersecond'=70378258;;;0; 'internet.bandwidth.upload.bitspersecond'=59736763;;;0;
The service is implemented at /etc/icinga2/conf.d/services as it is added to the main node of icinga2:
apply Service "speed-test" {
    import "speedtest-service"
    vars.warn_download = "20:"
    vars.crit_download = "15:"
    vars.warn_upload = "25:"
    vars.crit_upload = "20:"
    check_command = "centreon-speedtest"
  assign where host.name == NodeName
}
I don´t know what causes the problem. Has anyone a hint?
I looked a little further: the whisper files exists, also I´ve found the graphs at graphite itself. I don´t know why icingaweb2 doesn´t recognize these graphs.

