Hi
We’re monitoring a bunch of Ubuntu Linux VMs and one of the default checks applied is a network interface traffic check, performed via check_snmp, executed through the Icinga2 agent on the monitored server (so SNMP to localhost + just delivering the result back to the master).
This works fine, since 3+ years and all was good. Then we noticed strange values in the charts, when testing a host’s performance / network limits. The charts never showed the full value - but e.g. iperf3 on the CLI showed that the host performed well and as expected.
After some research we found that we used the 32 bit counters (ifInOctets or 1.3.6.1.2.1.2.2.1.10.x) and not the 64 bit counters that we should have used (ifHCInOctets or 1.3.6.1.2.1.31.1.1.1.6.2). We switched those OIDs in the monitoring config, configured the check to be via SNMP v2c (instead of v1 which does not provide the new OIDs). After that, the tests and the charts now showed the same output and we were happy and left it like this.
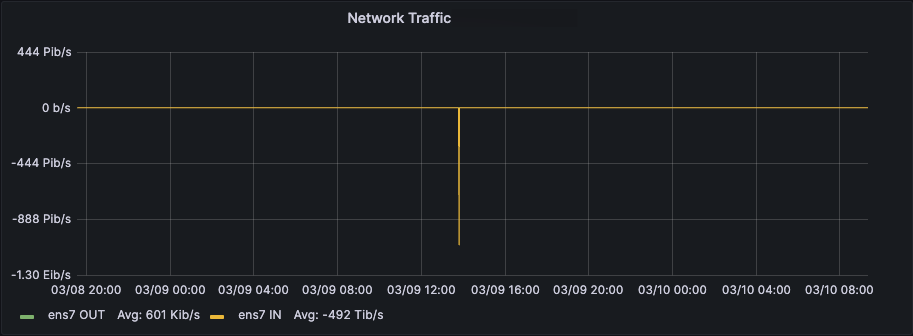
But over time, we noticed strange spikes in the charts (a server that usually moves traffic in the Kbits/s to some MBits/s range showes a short spike of traffic in the PetaBits/s range). At first we ignored it, but later found out it always happens when rebooting the VM.
We tried to automatically remove the state file of check_snmp prior to reboots to make sure this problem does not happen again - did not really solve the issue.
So I’m a bit lost and out of ideas: Does anyone know what happens here and how we could approach this to get it resolved?
How do you monitor network interfaces traffic for linux servers?
Cheers,
Mario
