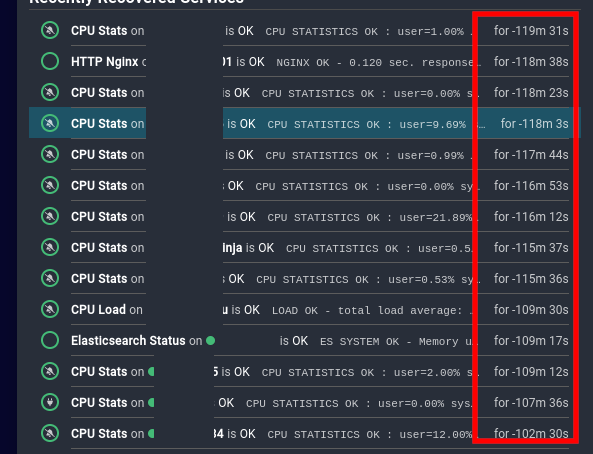
There’s something “buggy” I only realized today. Icingaweb constantly seems to flap between negative (last state change?) times and “normal” times. This results in values showing up as -119m.

I’ve seen this across all kinds of services since this morning. Not sure since when exactly this shows up like this because it only seems to affect the “Check Statistics” in the Icingaweb UI, the timings in the overview seem to be correct.
- Icinga Web 2 version: 2.14.0
- Used modules and their versions (System - About): doc, icingadb, migrate
- Web browser used: Firefox 153
- Icinga 2 version used (
icinga2 --version): 2.16.4-1 - PHP version used (
php --version): 8.4.24 - Server operating system and version: Debian 12
The following GIF shows this flapping pretty cleary.
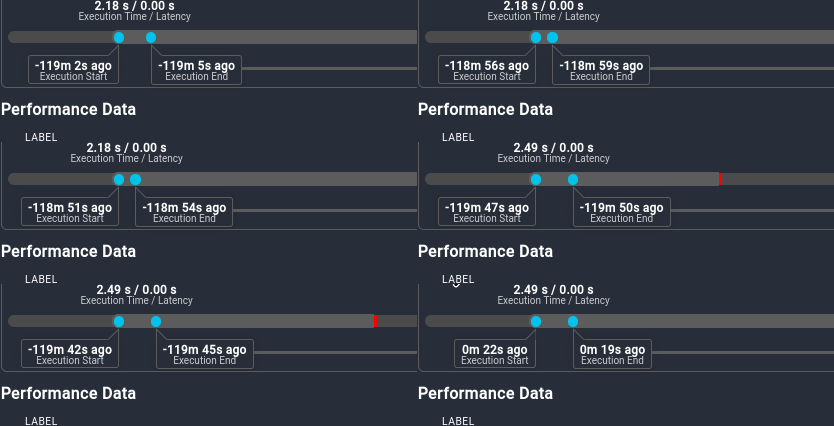
I first expected a problem I’ve had in the past, when a monitoring server jumped into the future due to NTP issue ( Servertime in the future breaks check results processing · Issue #6797 · Icinga/icinga2 · GitHub ), but that isn’t the case. I verified the execution timestamps (from the state file) and none of them were in the future.
Or am I looking in the wrong spot and should focus on Icingadb instead?
Update: I just realized this “glitch” also shows up in the overview from time to time, but only for a couple of seconds!