Multiple errors <Timeout exceeded.><Terminated by signal 15 (Terminated).>

Hello everyone.
I’m trying to migrate an old Icinga instance to a new one.
However in my new instance, I have multiple errors in /var/log/icinga2/icinga2.log.
I have followed this link and this one, but I already have the parameter KillMode=mixed in my /usr/lib/systemd/system/icinga2.service file.
Can someone please help solve me this?
Thank you very much.

My specifications are the following:

Operating System and version:
CentOS7 version 7.9.2009

Enabled features:
Disabled features: command compatlog debuglog elasticsearch gelf icingadb influxdb influxdb2 livestatus opentsdb perfdata statusdata syslog
Enabled features: api checker graphite ido-mysql mainlog notification

Icinga Web 2 version and modules:
icinga2 - 2.13.2-1
icingaweb2 - 2.9.5
modules: doc graphite map monitoring

Config validation:
[2022-01-05 11:35:01 +0000] information/cli: Icinga application loader (version: 2.13.2-1)
[2022-01-05 11:35:01 +0000] information/cli: Loading configuration file(s).
[2022-01-05 11:35:01 +0000] information/ConfigItem: Committing config item(s).
[2022-01-05 11:35:01 +0000] information/ApiListener: My API identity: srvmon04.contoso.com
[2022-01-05 11:35:05 +0000] information/ConfigItem: Instantiated 1 GraphiteWriter.
[2022-01-05 11:35:05 +0000] information/ConfigItem: Instantiated 1 NotificationComponent.
[2022-01-05 11:35:05 +0000] information/ConfigItem: Instantiated 1 IdoMysqlConnection.
[2022-01-05 11:35:05 +0000] information/ConfigItem: Instantiated 1 CheckerComponent.
[2022-01-05 11:35:05 +0000] information/ConfigItem: Instantiated 1 User.
[2022-01-05 11:35:05 +0000] information/ConfigItem: Instantiated 1 UserGroup.
[2022-01-05 11:35:05 +0000] information/ConfigItem: Instantiated 8 ServiceGroups.
[2022-01-05 11:35:05 +0000] information/ConfigItem: Instantiated 3 TimePeriods.
[2022-01-05 11:35:05 +0000] information/ConfigItem: Instantiated 5171 Services.
[2022-01-05 11:35:05 +0000] information/ConfigItem: Instantiated 3 Zones.
[2022-01-05 11:35:05 +0000] information/ConfigItem: Instantiated 1 ScheduledDowntime.
[2022-01-05 11:35:05 +0000] information/ConfigItem: Instantiated 2 NotificationCommands.
[2022-01-05 11:35:05 +0000] information/ConfigItem: Instantiated 256 HostGroups.
[2022-01-05 11:35:05 +0000] information/ConfigItem: Instantiated 12 Notifications.
[2022-01-05 11:35:05 +0000] information/ConfigItem: Instantiated 2 Downtimes.
[2022-01-05 11:35:05 +0000] information/ConfigItem: Instantiated 1 IcingaApplication.
[2022-01-05 11:35:05 +0000] information/ConfigItem: Instantiated 5345 Hosts.
[2022-01-05 11:35:05 +0000] information/ConfigItem: Instantiated 1 Endpoint.
[2022-01-05 11:35:05 +0000] information/ConfigItem: Instantiated 1 FileLogger.
[2022-01-05 11:35:05 +0000] information/ConfigItem: Instantiated 1 ApiUser.
[2022-01-05 11:35:05 +0000] information/ConfigItem: Instantiated 244 CheckCommands.
[2022-01-05 11:35:05 +0000] information/ConfigItem: Instantiated 1 ApiListener.
[2022-01-05 11:35:05 +0000] information/ScriptGlobal: Dumping variables to file ‘/var/cache/icinga2/icinga2.vars’
[2022-01-05 11:35:05 +0000] information/cli: Finished validating the configuration file(s).

Here’s some part of the log:

[2022-01-05 07:46:39 +0000] warning/Process: PID 1173 was terminated by signal 15 (Terminated)
[2022-01-05 07:46:39 +0000] warning/PluginCheckTask: Check command for object ‘es-png01-router!ping4’ (PID: 1173, arguments: ‘/usr/lib64/nagios/plugins/check_ping’ ‘-4’ ‘-H’ ‘10.107.132.1’ ‘-c’ ‘100000,120%’ ‘-w’ ‘50000,100%’) terminated with exit code 128, output: <Terminated by signal 15 (Terminated).>
[2022-01-05 07:46:41 +0000] warning/Process: Terminating process 1418 (‘/usr/lib64/nagios/plugins/check_ping’ ‘-H’ ‘10.111.15.1’ ‘-c’ ‘100000,120%’ ‘-w’ ‘50000,100%’) after timeout of 60 seconds
[2022-01-05 07:46:41 +0000] warning/Process: PID 1418 was terminated by signal 15 (Terminated)
[2022-01-05 07:46:41 +0000] warning/PluginCheckTask: Check command for object ‘fr-mfac5-router’ (PID: 1418, arguments: ‘/usr/lib64/nagios/plugins/check_ping’ ‘-H’ ‘10.111.15.1’ ‘-c’ ‘100000,120%’ ‘-w’ ‘50000,100%’) terminated with exit code 128, output: <Terminated by signal 15 (Terminated).>
[2022-01-05 07:46:44 +0000] warning/Process: Terminating process 1665 (‘/usr/lib64/nagios/plugins/check_ping’ ‘-H’ ‘10.103.3.1’ ‘-c’ ‘100000,120%’ ‘-w’ ‘50000,100%’) after timeout of 60 seconds
[2022-01-05 07:46:44 +0000] warning/Process: PID 1665 was terminated by signal 15 (Terminated)
[2022-01-05 07:46:44 +0000] warning/Process: Terminating process 1684 (‘/usr/lib64/nagios/plugins/check_ping’ ‘-H’ ‘10.107.165.1’ ‘-c’ ‘100000,120%’ ‘-w’ ‘50000,100%’) after timeout of 60 seconds
[2022-01-05 07:46:44 +0000] warning/PluginCheckTask: Check command for object ‘fr-mfr03-router’ (PID: 1665, arguments: ‘/usr/lib64/nagios/plugins/check_ping’ ‘-H’ ‘10.103.3.1’ ‘-c’ ‘100000,120%’ ‘-w’ ‘50000,100%’) terminated with exit code 128, output: <Terminated by signal 15 (Terminated).>
[2022-01-05 07:46:44 +0000] warning/Process: PID 1684 was terminated by signal 15 (Terminated)
[2022-01-05 07:46:44 +0000] warning/PluginCheckTask: Check command for object ‘gr-col17-router’ (PID: 1684, arguments: ‘/usr/lib64/nagios/plugins/check_ping’ ‘-H’ ‘10.107.165.1’
‘-c’ ‘100000,120%’ ‘-w’ ‘50000,100%’) terminated with exit code 128, output: <Terminated by signal 15 (Terminated).>
[2022-01-05 07:46:44 +0000] warning/Process: Terminating process 1717 (‘/usr/lib64/nagios/plugins/check_ping’ ‘-4’ ‘-H’ ‘10.107.103.1’ ‘-c’ ‘100000,120%’ ‘-w’ ‘50000,100%’) after timeout of 60 seconds

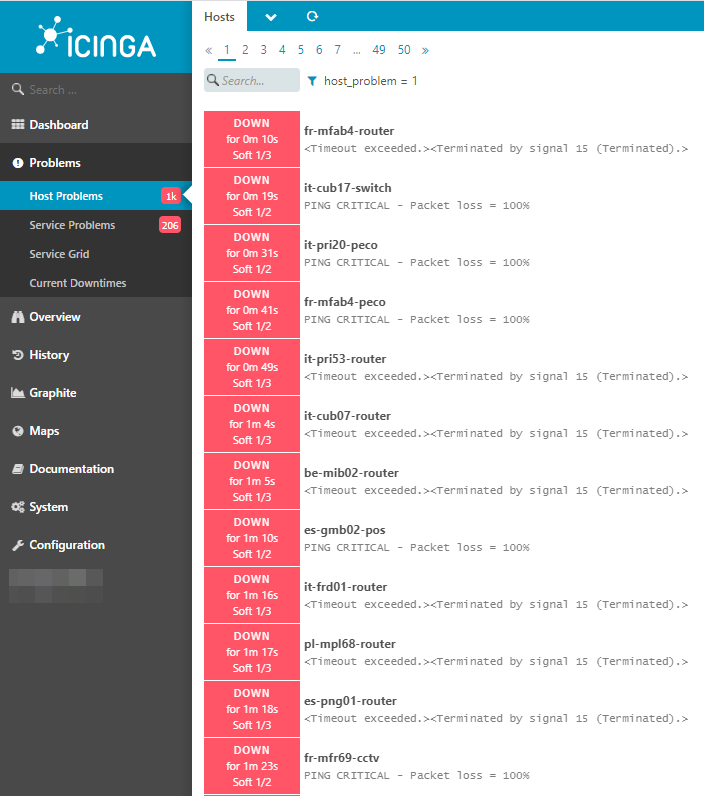
Currently my frontend looks like this:

Hello everyone.
I’m trying to migrate an old Icinga instance to a new one.

Please give us some more information about what “migrate” means.

You’ve told us:

icinga2 - 2.13.2-1
icingaweb2 - 2.9.5

Are those the versions of the old system, or the new one, or both? (In other
words, are you purely migrating from one machine to another, running the same
versions of software, or are you also doing an upgrade of Icinga at the same
time?)

The errors you are reporting, such as:

Check command for object ‘fr-mfac5-router’ (PID: 1418, arguments:
‘/usr/lib64/nagios/plugins/check_ping’ ‘-H’ ‘10.111.15.1’ ‘-c’ ‘100000,120%’
‘-w’ ‘50000,100%’) terminated with exit code 128, output: <Terminated by signal 15 (Terminated).>

raise the questions:

  1. is the address 10.111.15.1 contactable from the new machine you have
    migrated to?

  2. what happens if you simply try a command-line ping from the new server to
    that address?

  3. what happens if you manually run the service check command:
    /usr/lib64/nagios/plugins/check_ping -H 10.111.15.1 -c 100000,120% -w
    50000,100%

PS: What sense does “120% packet loss” make?

Antony.

Hello Antony.
Thank you for the quick reply and I apologize for the lack of information given and thank you so much for helping me.
I’m migrating from one machine to another. The old version was (icinga2 - r2.7.1-1/
icingaweb2 - 2.4.2).

  1. is the address 10.111.15.1 contactable from the new machine you have
    migrated to?

I’m sorry, actually that is a bad example because this one is not reachable.

  1. what happens if you simply try a command-line ping from the new server to
    that address?

Please check screenshot below regarding the address 10.107.132.1. I’ve interrupted the ping because it was not responding, as soon as I stopped Icinga, the ping succedeed. (my VM interface speed is 10000Mb/s).
image

  1. what happens if you manually run the service check command:
    I have the following output:
    PING OK - Packet loss = 70%, RTA = 43.89 ms|rta=43.894001ms;50000.000000;100000.000000;0.000000 pl=70%;100;120;0
    and again:
    PING OK - Packet loss = 93%, RTA = 48.25 ms|rta=48.254002ms;50000.000000;100000.000000;0.000000 pl=93%;100;120;0

For comparison, here’s below output from the new icinga server and the old icinga server:

New Server:

Old Server:

P.S. What sense does “120% packet loss” make?
Actually I have no idea, since this configuration was not made by me, and since the idea was to migrate Icinga to a new server, with the latest release, I’m trying to replicate the old environment, so I also added the following to templates.conf:

template Host “generic-poc” {
max_check_attempts = 2
check_interval = 30m
retry_interval = 10m
check_command = “hostalive”
vars.ping_wrta = 5000
vars.ping_wpl = 90
vars.ping_crta = 10000
vars.ping_cpl = 100
}

template Host “generic-poc-router” {
max_check_attempts = 3
check_interval = 6m
retry_interval = 2m
check_command = “hostalive”
vars.ping_wrta = 50000
vars.ping_wpl = 100
vars.ping_crta = 100000
vars.ping_cpl = 120
}

And in my host file I have this:

object Host “es-png01-router” {
address = “10.107.132.1”
vars.host_type = [“ES-ROUTER”,“jon doe”]
vars.map_icon = “sitemap”
import “generic-loja-router”
vars.geolocation = “37.878666, -4.765666”
vars.notificationhost = [“icingaadmins”]
}

Hello Antony.
Thank you for the quick reply and I apologize for the lack of information
given and thank you so much for helping me. I’m migrating from one machine
to another. The old version was (icinga2 - r2.7.1-1/ icingaweb2 - 2.4.2).

Well, 2.7.1 → 2.13.2 is quite a jump :slight_smile:

  1. is the address 10.111.15.1 contactable from the new machine you have
    migrated to?

I’m sorry, actually that is a bad example because this one is not
reachable.

Well, that at least explains the error message you got :slight_smile:

  1. what happens if you simply try a command-line ping from the new server
    to that address?

Please check screenshot below regarding the address 10.107.132.1.

Sorry, but this list/forum does not send images to people subscribed by email
(which I am). Please copy/paste any important output.

I’ve interrupted the ping because it was not responding, as soon as I
stopped Icinga, the ping succedeed.

That sounds most odd - I’ll be fascinated to see what ping command you were
running for any application to make a difference to the result.

  1. what happens if you manually run the service check command:
    I have the following output:
    PING OK - Packet loss = 70%, RTA = 43.89
    ms>rta=43.894001ms;50000.000000;100000.000000;0.000000 pl=70%;100;120;0
    and again:
    PING OK - Packet loss = 93%, RTA = 48.25
    ms>rta=48.254002ms;50000.000000;100000.000000;0.000000 pl=93%;100;120;0

Good grief - 70% and 93% packet loss!?

Something is really not good with that network link. Do you believe that this
result is correct?

P.S. What sense does “120% packet loss” make?

Actually I have no idea, since this configuration was not made by me

Okay :slight_smile:

Antony.

It really is, that’s why we decided to migrate.

Indeed :upside_down_face:

Actually it was a screenshot of a ping to 10.107.132.1 that was not getting any reply, and only started to work after I stopped the Icinga Service.

I’m sorry for asking, but how do I check that?

No it isn’t, that’s actually what i feel the problem is.
Take a look at the outputs from the new server and the old server:

New Server:

[root@pocmon04 poc]# /usr/lib64/nagios/plugins/check_ping -H 10.107.132.1 -c 100000,120% -w 50000,100%
PING OK - Packet loss = 0%, RTA = 43.96 ms|rta=43.963001ms;50000.000000;100000.000000;0.000000 pl=0%;100;120;0
[root@pocmon04 poc]# /usr/lib64/nagios/plugins/check_ping -H 10.107.132.1 -c 100000,120% -w 50000,100%
PING OK - Packet loss = 93%, RTA = 48.25 ms|rta=48.254002ms;50000.000000;100000.000000;0.000000 pl=93%;100;120;0
[root@pocmon04 poc]# /usr/lib64/nagios/plugins/check_ping -H 10.107.132.1 -c 100000,120% -w 50000,100%
PING OK - Packet loss = 28%, RTA = 44.10 ms|rta=44.097000ms;50000.000000;100000.000000;0.000000 pl=28%;100;120;0
[root@pocmon04 poc]# /usr/lib64/nagios/plugins/check_ping -H 10.107.132.1 -c 100000,120% -w 50000,100%
PING OK - Packet loss = 89%, RTA = 44.08 ms|rta=44.081001ms;50000.000000;100000.000000;0.000000 pl=89%;100;120;0

Old Server:

[root@prficinga2poc icinga2]# /usr/lib64/nagios/plugins/check_ping -H 10.107.132.1 -c 100000,120% -w 50000,100%
PING OK - Packet loss = 0%, RTA = 43.42 ms|rta=43.421001ms;50000.000000;100000.000000;0.000000 pl=0%;100;120;0
[root@prficinga2poc icinga2]# /usr/lib64/nagios/plugins/check_ping -H 10.107.132.1 -c 100000,120% -w 50000,100%
PING OK - Packet loss = 0%, RTA = 43.38 ms|rta=43.384998ms;50000.000000;100000.000000;0.000000 pl=0%;100;120;0
[root@prficinga2poc icinga2]# /usr/lib64/nagios/plugins/check_ping -H 10.107.132.1 -c 100000,120% -w 50000,100%
PING OK - Packet loss = 0%, RTA = 43.51 ms|rta=43.505001ms;50000.000000;100000.000000;0.000000 pl=0%;100;120;0
[root@prficinga2poc icinga2]# /usr/lib64/nagios/plugins/check_ping -H 10.107.132.1 -c 100000,120% -w 50000,100%
PING OK - Packet loss = 0%, RTA = 43.13 ms|rta=43.126999ms;50000.000000;100000.000000;0.000000 pl=0%;100;120;0
[root@prficinga2poc icinga2]# /usr/lib64/nagios/plugins/check_ping -H 10.107.132.1 -c 100000,120% -w 50000,100%
PING OK - Packet loss = 0%, RTA = 43.33 ms|rta=43.327999ms;50000.000000;100000.000000;0.000000 pl=0%;100;120;0

Please help :)

I’m sorry for asking, but how do I check that?

I’m just asking you to quote here the exact command you typed.

Was it simply:

ping 10.107.132.1

?

No it isn’t, that’s actually what i feel the problem is.
Take a look at the outputs from the new server and the old server:

Okay, tell us more about the differences between the old and new servers:

  1. Are they both physical machines, are they both virtual servers, or a
    mixture?

  2. Are they both running the same distribution of Linux? Which versions?

  3. Are they both on the same subnet in your network? If not, what’s the
    difference in connectivity between the old machine → 10.107.132.1 and the new
    machine → 10.107.132.1?

  4. Finally, how did you install Icinga on the new server? From repository
    packages (if so, which repository), or something else (what)?

Antony.

Hello Antony.
Yes it was a simple ping 10.107.132.1.

But actually, speaking with a colleague here, he said that he had the same problem in the old server and by adjusting the parameters in templates.conf (as show above), the problem diminished (but was not completely solved.
So, not to be a jerk or anything, I would like your help to try to get to the root of the problem because a colleague of mine said he had the same problem when the new server was installed (by an MSP) and by messing with templates.conf the problem did not went away but slowed down a bit. (not an ideal solution imho).
Basically, I installed a new Icinga in a new server to monitor about 5000 hosts by simply pinging them.
Oh, and here’s the specs of the VM’s.

Old server: 8 cpus, 24GB ram, 120 HDD.
New Server: 2 cpus, 4GB ram, 40 HDD

Before you say anything about the specs, I can see low consumption in VMWare of cpu, memory, and network.

Oh, and the old server was a clone of another one.
Basically, we had only one Icinga Server to monitor headquarters and our branches, and it was cloned to divide the monitoring of headquarters infrastructure and the monitoring of branches.

Now, I’m migrating the Icinga that is monitoring our branches.
My next step is to migrate the icinga for headquarters (this one will be hard, because it has agent checking).