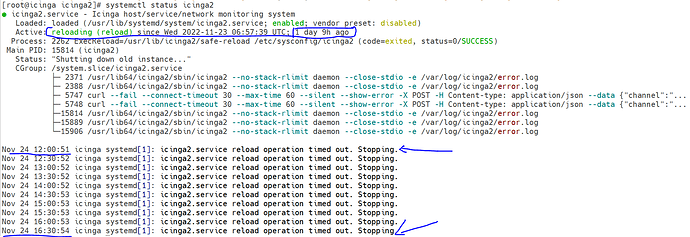
icinga version:- version: r2.13.4-1
Icinga Web 2 Version 2.9.5
even issue in environment where Icinga Web 2 Version 2.11.1
Getting this error in all the non-Prod and Prod envs intermittently
in one env memory utilization was almost hundred. then increased cpu/memory still memory utilization is near 100%.
  PID  PPID %MEM %CPU CMD
19640 12208  0.4  166 /usr/lib64/icinga2/sbin/icinga2 --no-stack-rlimit daemon --close-stdio -e /var/log/icinga2/error.log
 1976  1748  0.8 92.7 /usr/libexec/mysqld --basedir=/usr --datadir=/var/lib/mysql --plugin-dir=/usr/lib64/mysql/plugin --log-error=/var/log/mariadb/mariadb.log --pid-file=/var/run/mariadb/mariadb.pid --socket=/var/lib/mysql/mysql.sock
In Prod using Cloud SQL while in non prod using local VMs:-
cloud sql query insights shows for Prod below query consuming a lot:-
DELETE FROM icinga_notifications WHERE instance_id = ? AND start_time < FROM_UNIXTIME (?)
But I doubt for this as it is running for long time without any issues…
Behaviour is intermittent so difficult to capture but saw below errors in one of the environment:-
[2022-11-14 15:16:56 +0000] warning/PluginUtility: Error evaluating set_if value 'False' used in argument '-S': Can't convert 'False' to a floating point number.
Context:
        (0) Executing check for object 'alto-na-endpoints!check-alto-prod-tenant-kibana'


[2022-11-14 15:16:59 +0000] information/IdoMysqlConnection: Pending queries: 4496 (Input: 35/s; Output: 771/s)
[2022-11-14 15:17:09 +0000] information/IdoMysqlConnection: Pending queries: 4854 (Input: 36/s; Output: 771/s)
[2022-11-14 15:17:17 +0000] information/ConfigObject: Dumping program state to file '/var/lib/icinga2/icinga2.state'
[2022-11-14 15:17:19 +0000] information/IdoMysqlConnection: Pending queries: 5272 (Input: 41/s; Output: 771/s)
[2022-11-14 15:17:29 +0000] information/IdoMysqlConnection: Pending queries: 5823 (Input: 53/s; Output: 771/s)
[2022-11-14 15:17:39 +0000] information/IdoMysqlConnection: Pending queries: 6322 (Input: 49/s; Output: 771/s)
[2022-11-14 15:17:49 +0000] information/IdoMysqlConnection: Pending queries: 6830 (Input: 51/s; Output: 771/s)
[2022-11-14 15:17:59 +0000] information/IdoMysqlConnection: Pending queries: 7424 (Input: 59/s; Output: 771/s)
[2022-11-14 15:18:09 +0000] warning/PluginUtility: Error evaluating set_if value 'resource.label.cluster_name' used in argument '--group-by': Can't convert 'resource.label.cluster_name' to a floating point number.
Context:
        (0) Executing check for object 'mlisa-alto-prod-0-dataproc!hdfs-storage'


[2022-11-14 15:18:09 +0000] information/IdoMysqlConnection: Pending queries: 8082 (Input: 66/s; Output: 771/s)
[2022-11-14 15:18:19 +0000] information/IdoMysqlConnection: Pending queries: 4392 (Input: 93/s; Output: 461/s)
[2022-11-14 15:18:29 +0000] information/IdoMysqlConnection: Pending queries: 4952 (Input: 54/s; Output: 461/s)
[2022-11-14 15:18:34 +0000] warning/PluginUtility: Error evaluating set_if value 'resource.label.cluster_name' used in argument '--group-by': Can't convert 'resource.label.cluster_name' to a floating point number.
Context:
        (0) Executing check for object 'mlisa-sa-prod-0-dataproc!hdfs-storage'


[2022-11-14 15:18:43 +0000] warning/PluginUtility: Error evaluating set_if value 'resource.label.cluster_name' used in argument '--group-by': Can't convert 'resource.label.cluster_name' to a floating point number.
Context:
        (0) Executing check for object 'mlisa-alto-apac-prod-0-dataproc!hdfs-storage'


[2022-11-14 15:19:03 +0000] warning/PluginUtility: Error evaluating set_if value 'resource.label.cluster_name' used in argument '--group-by': Can't convert 'resource.label.cluster_name' to a floating point number.
Context:
        (0) Executing check for object 'mlisa-sa-apac-prod-0-dataproc!hdfs-storage'


[2022-11-14 15:19:19 +0000] information/IdoMysqlConnection: Pending queries: 2576 (Input: 43/s; Output: 460/s)
[2022-11-14 15:19:29 +0000] information/IdoMysqlConnection: Pending queries: 3109 (Input: 52/s; Output: 460/s)
In one another environment seeing below errors:-
[2022-11-21 16:48:51 +0000] warning/PluginNotificationTask: Notification command for object 'alto-na-login-service!login-service-login-784cdf7f55-dg6rj' (PID: 14014, arguments: 'sh' '-c' 'curl  --fail --connect-timeout 30 --max-time 60 --silent --show-error -X POST -H 'Content-type: application/json' --data '{"channel":"#monitoring_alerts","title":":red_circle: PROBLEM: Service <http://10.103.32.244/monitoring/service/show?host=alto-na-login-service&service=login-service-login-784cdf7f55-dg6rj|Failed to create tyk session for tenant 5e4c7f970f244bdab6c2ef69d04384c2> transitioned from state UNKNOWN to state CRITICAL"}' 'https://hooks.slack.com/workflows/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'') terminated with exit code 22, output: curl: (22) The requested URL returned error: 429 Too Many Requests
[2022-11-21 16:48:51 +0000] information/Notification: Completed sending 'Problem' notification 'alto-na-logstash-could-not-index-event-to-elasticsearch-from-dlq!logstash-could-not-index-event-to-elasticsearch-dynamic-activity!slack-notifications-notification-services' for checkable 'alto-na-logstash-could-not-index-event-to-elasticsearch-from-dlq!logstash-could-not-index-event-to-elasticsearch-dynamic-activity' and user 'icingaadmin' using command 'slack-notifications-command'.
[2022-11-21 16:48:51 +0000] warning/PluginNotificationTask: Notification command for object 'alto-na-broker-not-available!opd-collector-kafka-opdcollector-76d978f947-g55ql' (PID: 13989, arguments: 'sh' '-c' 'curl  --fail --connect-timeout 30 --max-time 60 --silent --show-error -X POST -H 'Content-type: application/json' --data '{"channel":"#monitoring_alerts","title":":red_circle: PROBLEM: Service <http://10.103.32.244/monitoring/service/show?host=alto-na-broker-not-available&service=opd-collector-kafka-opdcollector-76d978f947-g55ql|Pod opdcollector-76d978f947-g55ql cannot connect to Kafka broker. Please restart it> transitioned from state UNKNOWN to state CRITICAL"}' 'https://hooks.slack.com/workflows/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'') terminated with exit code 22, output: curl: (22) The requested URL returned error: 429 Too Many Requests
[2022-11-21 16:48:51 +0000] information/Notification: Completed sending 'Problem' notification 'alto-na-broker-not-available!opd-collector-kafka-opdcollector-548c6b7df-7vpvd!slack-notifications-notification-services' for checkable 'alto-na-broker-not-available!opd-collector-kafka-opdcollector-548c6b7df-7vpvd' and user 'icingaadmin' using command 'slack-notifications-command'.
[2022-11-21 16:48:51 +0000] information/Notification: Completed sending 'Problem' notification 'alto-na-login-service!login-service-login-b865b595c-q9l4z!slack-notifications-notification-services' for checkable 'alto-na-login-service!login-service-login-b865b595c-q9l4z' and user 'icingaadmin' using command 'slack-notifications-command'.
[2022-11-21 16:48:51 +0000] warning/PluginNotificationTask: Notification command for object 'alto-na-login-service!login-service-login-7486bc578b-glgwc' (PID: 13976, arguments: 'sh' '-c' 'curl  --fail --connect-timeout 30 --max-time 60 --silent --show-error -X POST -H 'Content-type: application/json' --data '{"channel":"#monitoring_alerts","title":":red_circle: PROBLEM: Service <http://10.103.32.244/monitoring/service/show?host=alto-na-login-service&service=login-service-login-7486bc578b-glgwc|Failed to create tyk session for tenant 162bb84c015c41a88a6996732da5e747> transitioned from state UNKNOWN to state CRITICAL"}' 'https://hooks.slack.com/workflows/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'') terminated with exit code 22, output: curl: (22) The requested URL returned error: 429 Too Many Requests
[2022-11-21 16:48:51 +0000] information/HttpServerConnection: Request: GET /v1/objects/services (from [::ffff:10.103.32.148]:58378), user: logstash, agent: Manticore 0.9.1, status: OK).
[2022-11-21 16:48:51 +0000] information/HttpServerConnection: Request: GET /v1/objects/services (from [::ffff:10.103.32.148]:58404), user: logstash, agent: Manticore 0.9.1, status: OK).
[2022-11-21 16:48:51 +0000] warning/PluginNotificationTask: Notification command for object 'alto-na-login-service!login-service-login-d86f6cdcb-kvd9f' (PID: 14085, arguments: 'sh' '-c' 'curl  --fail --connect-timeout 30 --max-time 60 --silent --show-error -X POST -H 'Content-type: application/json' --data '{"channel":"#monitoring_alerts","title":":red_circle: PROBLEM: Service <http://10.103.32.244/monitoring/service/show?host=alto-na-login-service&service=login-service-login-d86f6cdcb-kvd9f|Failed to create tyk session for tenant 7043f111bb34435c9882b8046ca21ad0> transitioned from state UNKNOWN to state CRITICAL"}' 'https://hooks.slack.com/workflows/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'') terminated with exit code 22, output: curl: (22) The requested URL returned error: 429 Too Many Requests
[2022-11-21 16:48:51 +0000] warning/PluginNotificationTask: Notification command for object 'alto-na-broker-not-available!opd-collector-kafka-opdcollector-77bb9664d9-62shh' (PID: 14006, arguments: 'sh' '-c' 'curl  --fail --connect-timeout 30 --max-time 60 --silent --show-error -X POST -H 'Content-type: application/json' --data '{"channel":"#monitoring_alerts","title":":red_circle: PROBLEM: Service <http://10.103.32.244/monitoring/service/show?host=alto-na-broker-not-available&service=opd-collector-kafka-opdcollector-77bb9664d9-62shh|Pod opdcollector-77bb9664d9-62shh cannot connect to Kafka broker. Please restart it> transitioned from state UNKNOWN to state CRITICAL"}' 'https://hooks.slack.com/workflows/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'') terminated with exit code 22, output: curl: (22) The requested URL returned error: 429 Too Many Requests
[2022-11-21 16:48:51 +0000] information/HttpServerConnection: Request: GET /v1/objects/services (from [::ffff:10.103.32.148]:58398), user: logstash, agent: Manticore 0.9.1, status: OK).
[2022-11-21 16:48:51 +0000] warning/PluginNotificationTask: Notification command for object 'alto-na-logstash-could-not-index-event-to-elasticsearch-from-dlq!logstash-could-not-index-event-to-elasticsearch-parse-failure-flux-helm-operator' (PID: 15320, arguments: 'sh' '-c' 'curl  --fail --connect-timeout 30 --max-time 60 --silent --show-error -X POST -H 'Content-type: application/json' --data '{"channel":"#monitoring_alerts","title":":red_circle: PROBLEM: Service <http://10.103.32.244/monitoring/service/show?host=alto-na-logstash-could-not-index-event-to-elasticsearch-from-dlq&service=logstash-could-not-index-event-to-elasticsearch-parse-failure-flux-helm-operator|[flux-helm-operator]: failed to parse field [version] of type [long] in document with id '1WPK04MBpjs3AWFbgxhC'. Preview of field's value: 'v3'> transitioned from state UNKNOWN to state CRITICAL"}' 'https://hooks.slack.com/workflows/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'') terminated with exit code 1, output: sh: -c: line 0: unexpected EOF while looking for matching `"'
sh: -c: line 1: syntax error: unexpected end of file
as errors are not common so could not relate.
