Monitoring Avaya Communication Management

Hello,

I am trying to figure out how can we monitor Avaya Communication management. We have set up SNMPV3 and its working. What is the nhext step to get more check to work. Do i need some OID from avaya?
What are the possibilities with Avaya monitors?

Never used Avaya before. Maybe it haves some kind of Health Endpoints in an API?

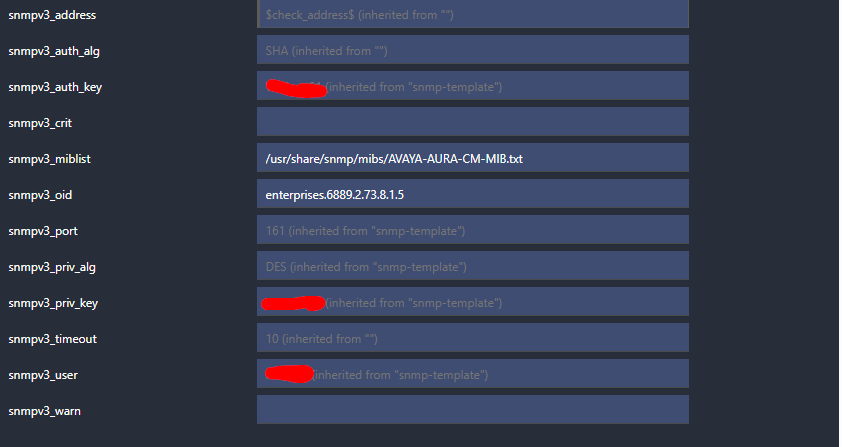
I use the monitoring-plugins/check-plugins/snmp at main · Linuxfabrik/monitoring-plugins · GitHub plugin with the following csv files.

acm.csv

OID,Name,Re-Calc,Unit Label,WARN,CRIT,Show in 1st Line,Report Change as
SNMPv2-SMI::enterprises.6889.2.73.8.1.4.6.0,Server1 Duplication State,,,,,,
SNMPv2-SMI::enterprises.6889.2.73.8.1.4.9.0,Server2 Duplication State,,,,,,
SNMPv2-SMI::enterprises.6889.2.73.8.1.4.4.0,Server1 Name,,,,,,
SNMPv2-SMI::enterprises.6889.2.73.8.1.4.7.0,Server2 Name,,,,,,
SNMPv2-SMI::enterprises.6889.2.73.8.1.4.13.0,StandBY Server Refreshed,,,,,,
SNMPv2-SMI::enterprises.6889.2.73.8.1.20.6.0,License Limit,int(value),,,,,
SNMPv2-SMI::enterprises.6889.2.73.8.1.20.4.0,Licenses used,int(value),,,,,
,warnPercent,95,%,,,,
,critPercent,98,%,,,,
,License Usage,"round(values['Licenses used'] * 100.0 / values['License Limit'],1)",%,value > values['warnPercent'],value > values['critPercent'],True,

acm_freshness.csv

OID,Name,Re-Calc,Unit Label,WARN,CRIT,Show in 1st Line,Report Change as
SNMPv2-SMI::enterprises.6889.2.73.8.1.4.13.0,StandBY Server Refreshed,,,,,,WARN

acm_license.csv

OID,Name,Re-Calc,Unit Label,WARN,CRIT,Show in 1st Line,Report Change as
SNMPv2-SMI::enterprises.6889.2.73.8.1.20.6.0,License Limit,int(value),,,,,
SNMPv2-SMI::enterprises.6889.2.73.8.1.20.4.0,Licenses used,int(value),,,,,
,warnPercent,95,%,,,,
,critPercent,98,%,,,,
,License Usage,"round(values['Licenses used'] * 100.0 / values['License Limit'],1)",%,value > values['warnPercent'],value > values['critPercent'],True,

acm_server.csv

OID,Name,Re-Calc,Unit Label,WARN,CRIT,Show in 1st Line,Report Change as
SNMPv2-SMI::enterprises.6889.2.73.8.1.4.6.0,Server1 Duplication State,,,,,,WARN
SNMPv2-SMI::enterprises.6889.2.73.8.1.4.9.0,Server2 Duplication State,,,,,,WARN
SNMPv2-SMI::enterprises.6889.2.73.8.1.4.4.0,Server1 Name,,,,,,
SNMPv2-SMI::enterprises.6889.2.73.8.1.4.7.0,Server2 Name,,,,,,

sbc_advanced_licence_in_use.csv

OID,Name,Re-Calc,Unit Label,WARN,CRIT,Show in 1st Line,Report Change as
SNMPv2-SMI::enterprises.6889.2.77.11.4.0,SBC Advanced License in Use,,,,,,WARN

sbc_std_licence_in_use.csv

OID,Name,Re-Calc,Unit Label,WARN,CRIT,Show in 1st Line,Report Change as
SNMPv2-SMI::enterprises.6889.2.77.11.2.0,SBC Standard License in Use,int(value),,value > 100,,True,

sbc_total_active_calls.csv

OID,Name,Re-Calc,Unit Label,WARN,CRIT,Show in 1st Line,Report Change as
SNMPv2-SMI::enterprises.6889.2.77.1.3.1.10.0,StandBY Server Refreshed,,,,,,WARN

I have no clue how useful this is as I don’t administer the Avaya system but this is what they wanted.

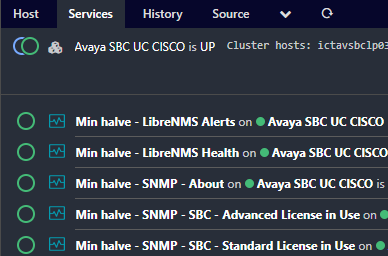
I also used some of my DSL magic to check over the simple checks aggregated on the cluster hosts.


object CheckCommand "116-cmd-min-halve" {
    import "plugin-check-command"
    command = [ "/usr/lib64/nagios/plugins/dummy" ]
    timeout = 10s
    arguments += {
        "--message" = {
            required = false
            value = {{
                var output_status = ""
                var up_count = 0
                var down_count = 0
                var cluster_nodes = macro("$116_cluster_nodes$")
                var min_halve_service_name = macro("$116-cluster-min-halve-service$")
            
                for (node in cluster_nodes) {
                  if (get_service(node, min_halve_service_name).state > 0) {
                    down_count += 1
                  } else {
                    up_count += 1
                  }
                }
            
                if (up_count >= down_count) {
                  output_status = "OK: "
                }
                if (up_count < down_count) {
                  output_status = "CRITICAL: "
                }
            
                var output = output_status
            
                for (node in cluster_nodes) {
                  output += node + ": " + min_halve_service_name + ": " + get_service(node, min_halve_service_name).last_check_result.output + " "
                }
            
                output += " | count_of_alive_" + min_halve_service_name +"="+up_count+";" + string((up_count + down_count) / 2 + 1) + ":;" + string((up_count + down_count) / 2 ) + ":;0;" + string(up_count + down_count)
                log(output)
                return output
            }}
        }
        "--state" = {{
            var up_count = 0
            var down_count = 0
            var cluster_nodes = macro("$116_cluster_nodes$")
            var min_halve_service_name = macro("$116-cluster-min-halve-service$")
        
            for (node in cluster_nodes) {
              if (get_service(node, min_halve_service_name).state > 0) {
                down_count += 1
              } else {
                up_count += 1
              }
            }
        
            if (up_count >= down_count) {
              return "ok" // halve up then down -> OK
            }
            if (up_count < down_count) {
              return "crit" // less up then down -> Critical 
            }
            return "unk" // should never reach this
        }}
    }
}
2 Likes

Thank you this is some very usefull information,

Can you explain me how to configure this in icinga?? Is it via web console or do you have to add/create something on the master?

I use the Icinga Director if you configure Icinga2 directly via the DSL then you don’t need the linuxfabrik’s dummy and can use the build in dummy for the code of the “116-cmd-min-halve” cluster CheckCommand.

For the SNMP check, the connection information is configured as every other check but the *.csv files need to be on the host where you placed the plugin in a directory at ./device-oids relative to the snmp check. Details are available at monitoring-plugins/check-plugins/snmp at main · Linuxfabrik/monitoring-plugins · GitHub the @linuxfabrik could also help if you have problems with setting it up.

Hi Dominik,

Thanks a lot for sharing this! Great information there!

However, I think I need several questions to be answered before I could reuse what you wrote:

  1. What are macro("$116_cluster_nodes$") and other “macro” commands doing, and what are the prerequisites for these to work?

  2. I suppose the 116 is some sort of naming convention. Could you please share how this naming convention works, and what problem it addresses?

  3. I thought the 116-cmd-min-halve CheckCommand would be associated with the Host, but I see it is using the Critical status (and not the Down status), so I am not sure. Can you please explicit how the 116-cmd-min-halve CheckCommand is related to the SNMP checks, and to the services we can see on the screenshots?

Thank you,

Jean

  1. it’s a field (director) I set on on the cluster host defining the hosts that act as cluster nodes.
    it looks like this in the Custom Variables:
cluster_nodes (Array)	2 items
[0]	ictavsbclp01.example.com
[1]	ictavsbclp02.example.com

or in the DSL

object Host "Avaya SBC SIP TRUNK" {
    import "tpl-host-cluster-dummy"

    vars["cluster_nodes"] = [ "ictavsbclp01.example.com", "ictavsbclp02.example.com" ]
    vars.teams = [ "Telefonie_Avaya" ]
}

https://icinga.com/docs/icinga-2/latest/doc/18-library-reference/#macro
2. yes, you can ignore all instances of 116 as it’s only a prefix to prevent overwriting variables and objects by the monitoring-plugins and lfops defaults. I removed it in this post.
3. it’s associated with the cluster host but it processes the status of the cluster-min-halve-service on the hosts defined in cluster_nodes. The only relation to the snmp checks is that I put them into cluster-min-halve-service, like so:

object Service "Min halve - SNMP - SBC - Advanced License in Use" {
    host_name = "Avaya SBC SIP TRUNK"
    import "cluster-min-halve"

    vars["cluster-min-halve-service"] = "SNMP - SBC - Advanced License in Use"
}
1 Like

Thanks a lot, it all makes sense, and this thread has been a real eye-opener for me!

I suppose the check to determine the Host status of the Cluster is not relevant (probably is a dummy check, or a ping check on the VIP).

1 Like

Correct, in this case it’s a dummy that’s also using the min-halve trick as I have no IP to ping, so I calculate the state by checking if at least one of the cluster_nodes is up. If there’s a cluster IP, I would use an other template that has the classical ping as host-alive check.

I have set up SNMPV3 command and sysuptime check. I got MIBS from the avaya and stored it in /usr/share/snmp/mibs/AVAYA-AURA-CM-MIB.txt.

I made new check for alarms but i am getting: SNMP OK - No Such Object available on this agent at this OID .

Use the Inspect action to get the actual command line and try to run it manually with debug and or verbose arguments.
Also try to get the OID you require with the net-snmp tools.