Hi Community out there,
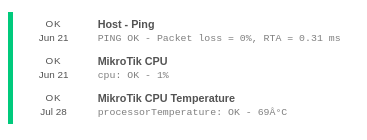
In our environment some MikroTik switch running, it was configured by ex employee for the monitoring point of view. Currently i can see only only two services MikroTik CPU and its temperature.
I would like to monitor more services like ports and its status.
As can see in the config :
If you’re using this plugin, check_mikrotik_switch :: Icinga Exchange, it looks like it supports a number of other metrics. You could copy the CheckCommands you have and use new names with different values for -t. The better long term solution may be to create one CheckCommand and then multiple Service Templates for each metric you want to monitor (and then apply those).
Note: The warning and critical values may not be what you expect for the temperature check, it looks like they were copied from the CPU check.
Could you please give me example of any of the following checks:
diskTotal
diskUsed
memTotal
memUsed
portName
portOperState
portAdminState
portMtu
portMacAddress
portRxDiscards
portTxDiscards
portTxErrors
portRxErrors
portRxPackets
portTxPackets
portTxBytes
portRxBytes
in term of this config :
object CheckCommand “mikrotik_cpu” {
command = [ PluginContribDir + “/check_mikrotik_switch.pl” ]
arguments = {
“-H” = “$address$”
“-C” = “r3c”
“-t” = “cpu”
“-w” = 80
“-c” = 90
You can simply replace “cpu” with any of those other metrics (and then apply the new CheckCommand). I would still suggest reading up on Service Templates. You’ll have to use your own discretion as to which metrics you want to monitor and what thresholds to use for each.