Sure thing, here are the requested informations:
Output of icinga2 daemon -C:
# icinga2 daemon -C
[2023-08-23 14:16:32 +0200] information/cli: Icinga application loader (version: r2.14.0-1)
[2023-08-23 14:16:32 +0200] information/cli: Loading configuration file(s).
[2023-08-23 14:16:32 +0200] information/ConfigItem: Committing config item(s).
[2023-08-23 14:16:32 +0200] information/ApiListener: My API identity: <REDACTED>

# here were about 290 warnings regarding apply rules for services and notifications, they are present but not used, which should not be a problem regarding memory in my understanding

[2023-08-23 14:16:41 +0200] information/ConfigItem: Instantiated 1 NotificationComponent.
[2023-08-23 14:16:41 +0200] information/ConfigItem: Instantiated 4 EventCommands.
[2023-08-23 14:16:41 +0200] information/ConfigItem: Instantiated 1 IdoMysqlConnection.
[2023-08-23 14:16:41 +0200] information/ConfigItem: Instantiated 941 Comments.
[2023-08-23 14:16:41 +0200] information/ConfigItem: Instantiated 1 CheckerComponent.
[2023-08-23 14:16:41 +0200] information/ConfigItem: Instantiated 118 Users.
[2023-08-23 14:16:41 +0200] information/ConfigItem: Instantiated 60 UserGroups.
[2023-08-23 14:16:41 +0200] information/ConfigItem: Instantiated 38 TimePeriods.
[2023-08-23 14:16:41 +0200] information/ConfigItem: Instantiated 26 ServiceGroups.
[2023-08-23 14:16:41 +0200] information/ConfigItem: Instantiated 1282 Zones.
[2023-08-23 14:16:41 +0200] information/ConfigItem: Instantiated 23728 Services.
[2023-08-23 14:16:41 +0200] information/ConfigItem: Instantiated 251 ScheduledDowntimes.
[2023-08-23 14:16:41 +0200] information/ConfigItem: Instantiated 21 NotificationCommands.
[2023-08-23 14:16:41 +0200] information/ConfigItem: Instantiated 8857 Notifications.
[2023-08-23 14:16:41 +0200] information/ConfigItem: Instantiated 1 FileLogger.
[2023-08-23 14:16:41 +0200] information/ConfigItem: Instantiated 1 IcingaApplication.
[2023-08-23 14:16:41 +0200] information/ConfigItem: Instantiated 2723 Hosts.
[2023-08-23 14:16:41 +0200] information/ConfigItem: Instantiated 282 HostGroups.
[2023-08-23 14:16:41 +0200] information/ConfigItem: Instantiated 1282 Endpoints.
[2023-08-23 14:16:41 +0200] information/ConfigItem: Instantiated 232 Downtimes.
[2023-08-23 14:16:41 +0200] information/ConfigItem: Instantiated 20005 Dependencies.
[2023-08-23 14:16:41 +0200] information/ConfigItem: Instantiated 13 ApiUsers.
[2023-08-23 14:16:41 +0200] information/ConfigItem: Instantiated 1 ApiListener.
[2023-08-23 14:16:41 +0200] information/ConfigItem: Instantiated 479 CheckCommands.
[2023-08-23 14:16:41 +0200] information/ConfigItem: Instantiated 1 GraphiteWriter.
[2023-08-23 14:16:41 +0200] information/ScriptGlobal: Dumping variables to file '/var/cache/icinga2/icinga2.vars'
[2023-08-23 14:16:41 +0200] information/cli: Finished validating the configuration file(s).
Ido Pending Queries:
The average seems to be between 500 - 600 pending queries, an Input rate between 80 an 100 per second and an output rate betweeen 40 - 40 per second.
See the below log entry for a typical one:
[2023-08-23 11:36:53 +0200] information/IdoMysqlConnection: Pending queries: 565 (Input: 87/s; Output: 42/s)
RelayQueue Rates:
Now this is where it gets interesting.
The rates seem to be horrible in my understanding.
See the following lines for up to date entries regarding this:
[2023-08-23 14:27:02 +0200] information/WorkQueue: #7 (ApiListener, RelayQueue) items: 3500824, rate: 0.0166667/s (1/min 18154/5min 66270/15min); empty in 2 hours, 23 minutes and 25 seconds
[2023-08-23 14:27:13 +0200] information/WorkQueue: #7 (ApiListener, RelayQueue) items: 3505178, rate: 0.0333333/s (2/min 18155/5min 66271/15min); empty in 2 hours, 38 minutes and 26 seconds
[2023-08-23 14:27:25 +0200] information/WorkQueue: #7 (ApiListener, RelayQueue) items: 3509305, rate: 0.0166667/s (1/min 18155/5min 66270/15min); empty in 2 hours, 48 minutes and 38 seconds
[2023-08-23 14:27:37 +0200] information/WorkQueue: #7 (ApiListener, RelayQueue) items: 3513528, rate: 0.0166667/s (1/min 18155/5min 66270/15min); empty in 2 hours, 44 minutes and 49 seconds
[2023-08-23 14:27:49 +0200] information/WorkQueue: #7 (ApiListener, RelayQueue) items: 3517875, rate: 0.0166667/s (1/min 18155/5min 66270/15min); empty in 2 hours, 40 minutes and 50 seconds
[2023-08-23 14:28:01 +0200] information/WorkQueue: #7 (ApiListener, RelayQueue) items: 3514005, rate: 133.317/s (7999/min 20900/5min 74268/15min); empty in less than 1 millisecond
[2023-08-23 14:28:13 +0200] information/WorkQueue: #7 (ApiListener, RelayQueue) items: 3518626, rate: 133.3/s (7998/min 20900/5min 74268/15min); empty in 2 hours, 30 minutes and 49 seconds
[2023-08-23 14:28:25 +0200] information/WorkQueue: #7 (ApiListener, RelayQueue) items: 3523114, rate: 133.3/s (7998/min 20900/5min 64307/15min); empty in 2 hours, 36 minutes and 50 seconds
[2023-08-23 14:28:37 +0200] information/WorkQueue: #7 (ApiListener, RelayQueue) items: 3527338, rate: 133.317/s (7999/min 13853/5min 64308/15min); empty in 2 hours, 46 minutes and 9 seconds
[2023-08-23 14:28:49 +0200] information/WorkQueue: #7 (ApiListener, RelayQueue) items: 3531144, rate: 133.317/s (7999/min 13853/5min 64308/15min); empty in 3 hours, 3 minutes and 45 seconds
[2023-08-23 14:29:01 +0200] information/WorkQueue: #7 (ApiListener, RelayQueue) items: 3535211, rate: 0.0166667/s (1/min 13853/5min 56672/15min); empty in 2 hours, 51 minutes and 59 seconds
[2023-08-23 14:29:13 +0200] information/WorkQueue: #7 (ApiListener, RelayQueue) items: 3539809, rate: 0.0166667/s (1/min 13853/5min 56672/15min); empty in 2 hours, 33 minutes and 26 seconds
[2023-08-23 14:29:25 +0200] information/WorkQueue: #7 (ApiListener, RelayQueue) items: 3544013, rate: 0.0333333/s (2/min 13814/5min 56673/15min); empty in 2 hours, 47 minutes and 44 seconds
[2023-08-23 14:29:37 +0200] information/WorkQueue: #7 (ApiListener, RelayQueue) items: 3548420, rate: 0.0166667/s (1/min 13814/5min 56673/15min); empty in 2 hours, 42 minutes and 12 seconds
This is not persistent though, there are times in the logs, were the queue only hold a few hundred or thousand items and says its empty in less than 1 millisecond:
[2023-08-23 10:25:20 +0200] information/WorkQueue: #7 (ApiListener, RelayQueue) items: 1336, rate: 324.083/s (19445/min 95105/5min 95105/15min); empty in less than 1 millisecond
There are also entries where it complains that the task handler is not able to keep up:
[2023-08-23 08:59:20 +0200] information/WorkQueue: #7 (ApiListener, RelayQueue) items: 15361348, rate: 0.0166667/s (1/min 4602/5min 15134/15min); empty in infinite time, your task handler isn't able to keep up
Overall the rate seems to not be constantly overwhelmed, but most of the time it seems.
There definetly seems to be an issue where icinga is not able to clear this queue fast enough, could this be related to the issue and/or could this lead to other issues as well?
Hardware Specs
16 CPUs @ 2.80GHz, 64 GB RAM, 650.0 GB Storage
Icinga Crash/Reload Frequency
We started observing this problem since around february this year, as you can see in this graph:
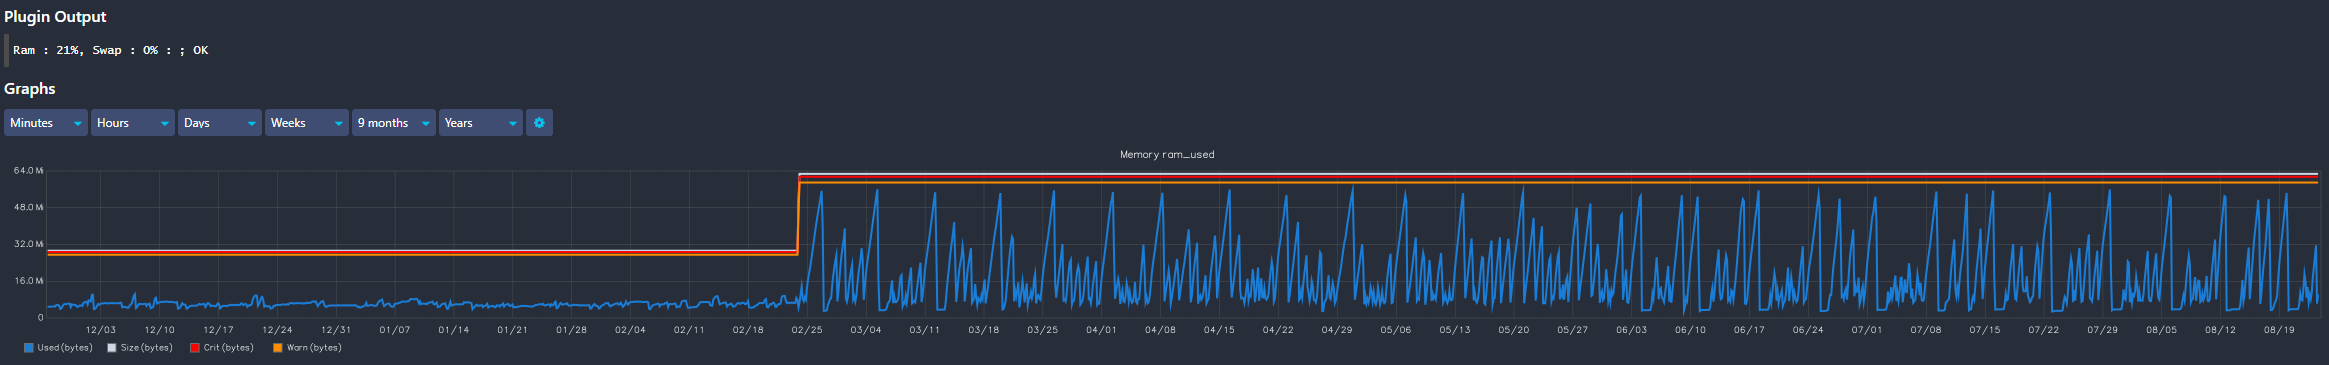
I can however not find any immediate cause for this since the last icinga update before this was on 16. january 2023 from 2.13.5 to 2.13.6 and the next update after this was in march 2023 to 2.13.7.
The general crash/reload frequency is about 2 times per week, which sometimes causes the service to not fully recover, which is of course no good for our production environment.
Edit
I hope this helps to better pinpoint the underlying problem.
If you need any other informations i will gladly provide it, thanks for looking into it @Al2Klimov ![]()