The MSP I work for monitors ~550 devices and a total of nearly 3k services on a very outdated Nagios 3.0.3 cluster. I’ve been working on migrating to Icinga2 but I’ve ran into a snag with graphing…
I am currently working on implementing a Graphite and Grafana stack running from docker images. I have been able to successfully get my data into Graphite using the default service template
icinga2.$host.name$.services.$service.name$.$service.check_command$
I have created a series of panels using the data for one of the Linux hosts we monitor

It’s not the prettiest set of graphs, but they work as proof of concept to my boss.
However, I noticed that when I change the hostname in the dropdown (this one being an ubuntu box), to say a Windows laptop, all of the panels say “No Data” except for the ping and hostalive panels.
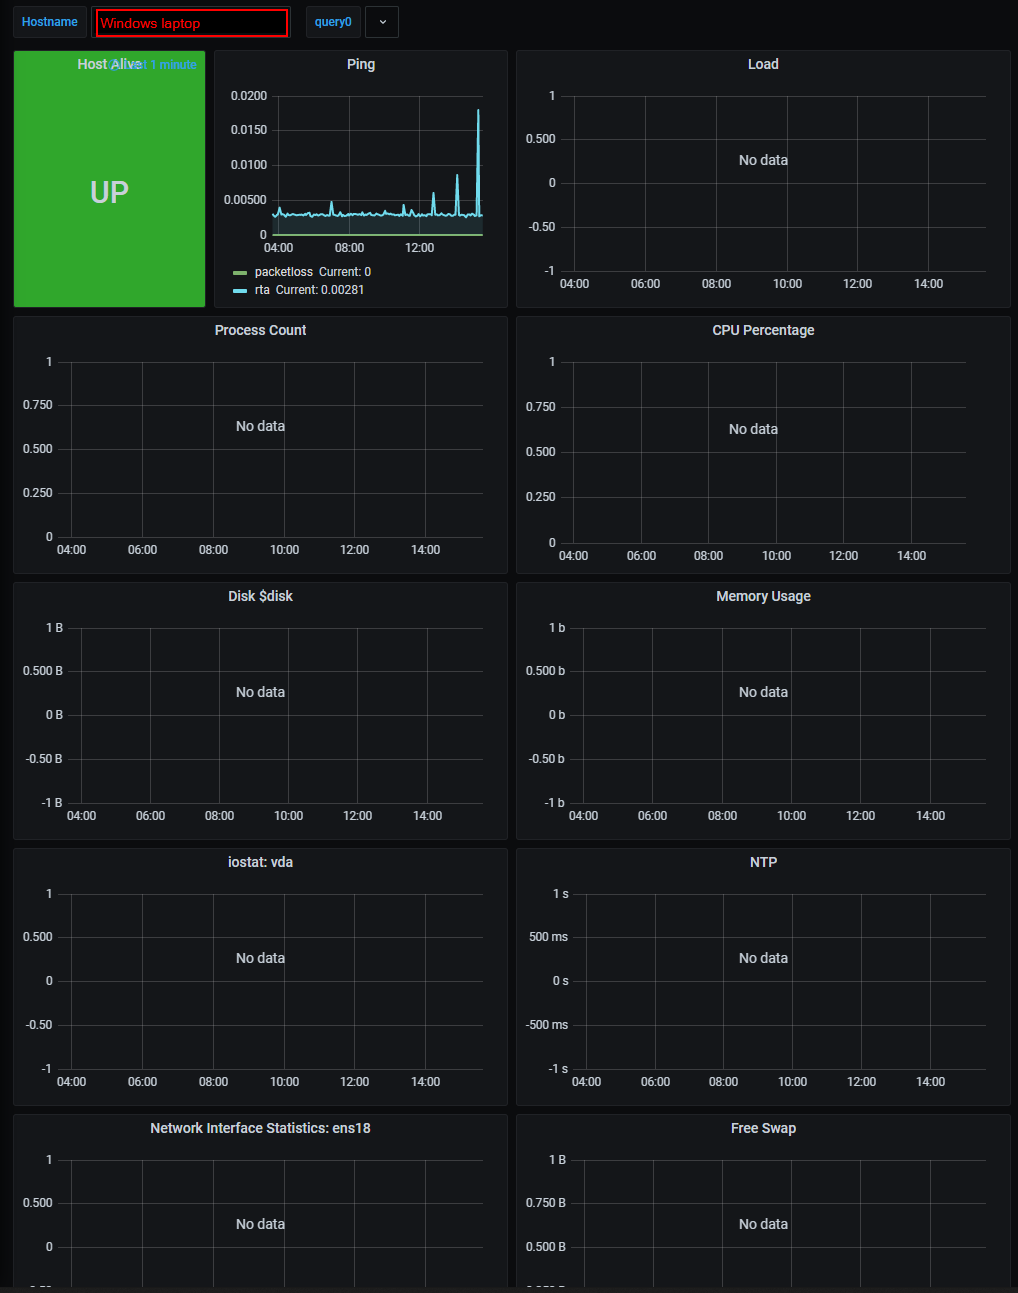
I understand the panels here would not function due to how the query works. The windows services even use different names. What I don’t understand is how I can create a dashboard that works for multiple devices. I need a different set of graphs to render for a network switch than I do a Proxmox host. Looking through the runtime macros, there doesn’t seem to be any way of passing details about the host via graphiteWriter for Grafana to query/filter with.
I’m unfortunately, very new to both Graphite and Grafana, having only started working with them in the last week or so. If there is an easier way to implement this, I’m open to suggestions. I’ve tried scouring Google and the forums here looking for anyone doing a similar setup but have been unable to find anything.