Hello there,
we have trouble displaying metrics from a (self developed) plugin monitoring BGP peers from FRR (https://frrouting.org).
(simplified) Plugin Output
FRR OK | 'DEAD:BEEF::6_uptime'=239402;; 'DEAD:BEEF::6_state'=6;; '127.0.0.1_uptime'=239402;; '127.0.0.1_state'=6;;
While the plugins output on the command line looks fine, the performance data’s labels in Icinga Web 2 are malformed:
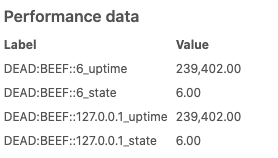
We could locate the issue in the ::6 in the label of the IPv6 peer metrics.
When replacing :: with : everything looks fine.
When monitoring only IPv6 or IPv4 peer information output is normal, too.
Did we discover a bug or is this expected behaviour?
Is there a way to escape the plugin’s output?
Icinga Web 2 Version 2.8.2 (Git commit 8a89839af94a247ee2149b2336c73b8251b477c0)
# icinga2 --version
icinga2 - The Icinga 2 network monitoring daemon (version: 2.12.0-1)

Copyright (c) 2012-2020 Icinga GmbH (https://icinga.com/)
License GPLv2+: GNU GPL version 2 or later <http://gnu.org/licenses/gpl2.html>
This is free software: you are free to change and redistribute it.
There is NO WARRANTY, to the extent permitted by law.

System information:
  Platform: CentOS Linux
  Platform version: 7 (Core)
  Kernel: Linux
  Kernel version: 3.10.0-1127.19.1.el7.x86_64
  Architecture: x86_64

Build information:
  Compiler: GNU 4.8.5
  Build host: runner-hh8q3bz2-project-322-concurrent-0
  OpenSSL version: OpenSSL 1.0.2k-fips  26 Jan 2017