Hello Community,
I am currently running a High Availability Cluster, and this is the setup for this question:
(master01/master02) → satellite01 (internal) → (satellite01/satellite02) (external).
And inside the external satellite zone, about 1k hosts (14k services) are checked with nrpe from the external satellites.
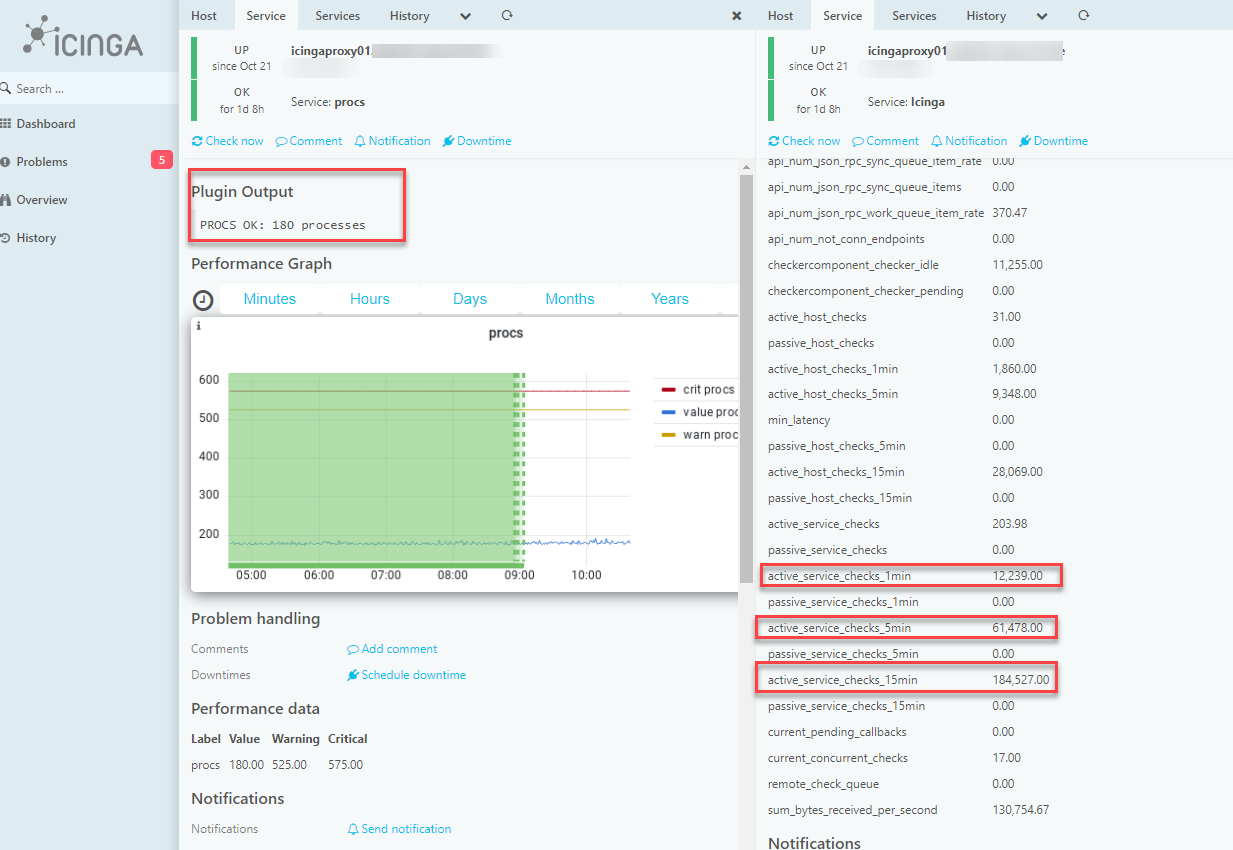
The setup with two satellites in the external zone (before it was only one satellite) has been running for a few days now, and I thought that both satellites would load balance the checks. But based on the procs, satellite01 has <200 procs and satellite02 has >400 procs. And comparing systemctl status icinga2.service, satellit02 is definitely running more checks than satellit01.
Each master/satellite is checked by the icinga check. I tried to read the active_service_checks metric, but the value is the same for both satellites.
-
Shouldn`t the value be different if one satellite does more checks than the other?
-
Any idea why the load balancing is not working properly?
satellite01 (external) zones.conf: (I changed the real domain to .internal and .external as in the description above)
object Endpoint "icingaproxy01.internal.de" {
        host = "ip"
        port = "5665"
}

object Zone "icingaproxy01.internal.de" {
        endpoints = [ "icingaproxy01.internal.de" ]
}

object Endpoint "icingaproxy01.external.de" {
}

object Endpoint "icingaproxy02.external.de" {
        host = "ip"
        port = "5665"
}

object Zone "icingaproxy01.external.de" {
        endpoints = [ "icingaproxy01.external.de", "icingaproxy02.external.de" ]
        parent = "icingaproxy01.internal.de"
}

object Zone "global-templates" {
        global = true
}
satellite02 (external) zones.conf:
object Endpoint "icingaproxy01.internal.de" {
        host = "ip"
        port = "5665"
}

object Zone "icingaproxy01.internal.de" {
        endpoints = [ "icingaproxy01.internal.de" ]
}

object Endpoint "icingaproxy01.external.de" {
        host = "ip"
        port = "5665"
}

object Endpoint "icingaproxy02.external.de" {
}

object Zone "icingaproxy01.external.de" {
        endpoints = [ "icingaproxy01.external.de", "icingaproxy02.external.de" ]
        parent = "icingaproxy01.internal.de"
}

object Zone "global-templates" {
        global = true
}
- Version used (
r2.13.2-1) - Operating System and version:
Debian 11 - Enabled features (
api checker mainlog(satellites),api checker ido-mysql influxdb2 mainlog notification(masters))