- Director version : 1.9.1
- Icinga Web 2 version and modules : 2.11.1
- Icinga 2 version : 2.13-5.1
- Operating System and version: linux redhat 7.6
- Webserver, PHP versions: 7.3
- Icingadb : 1.0.1
Hello,
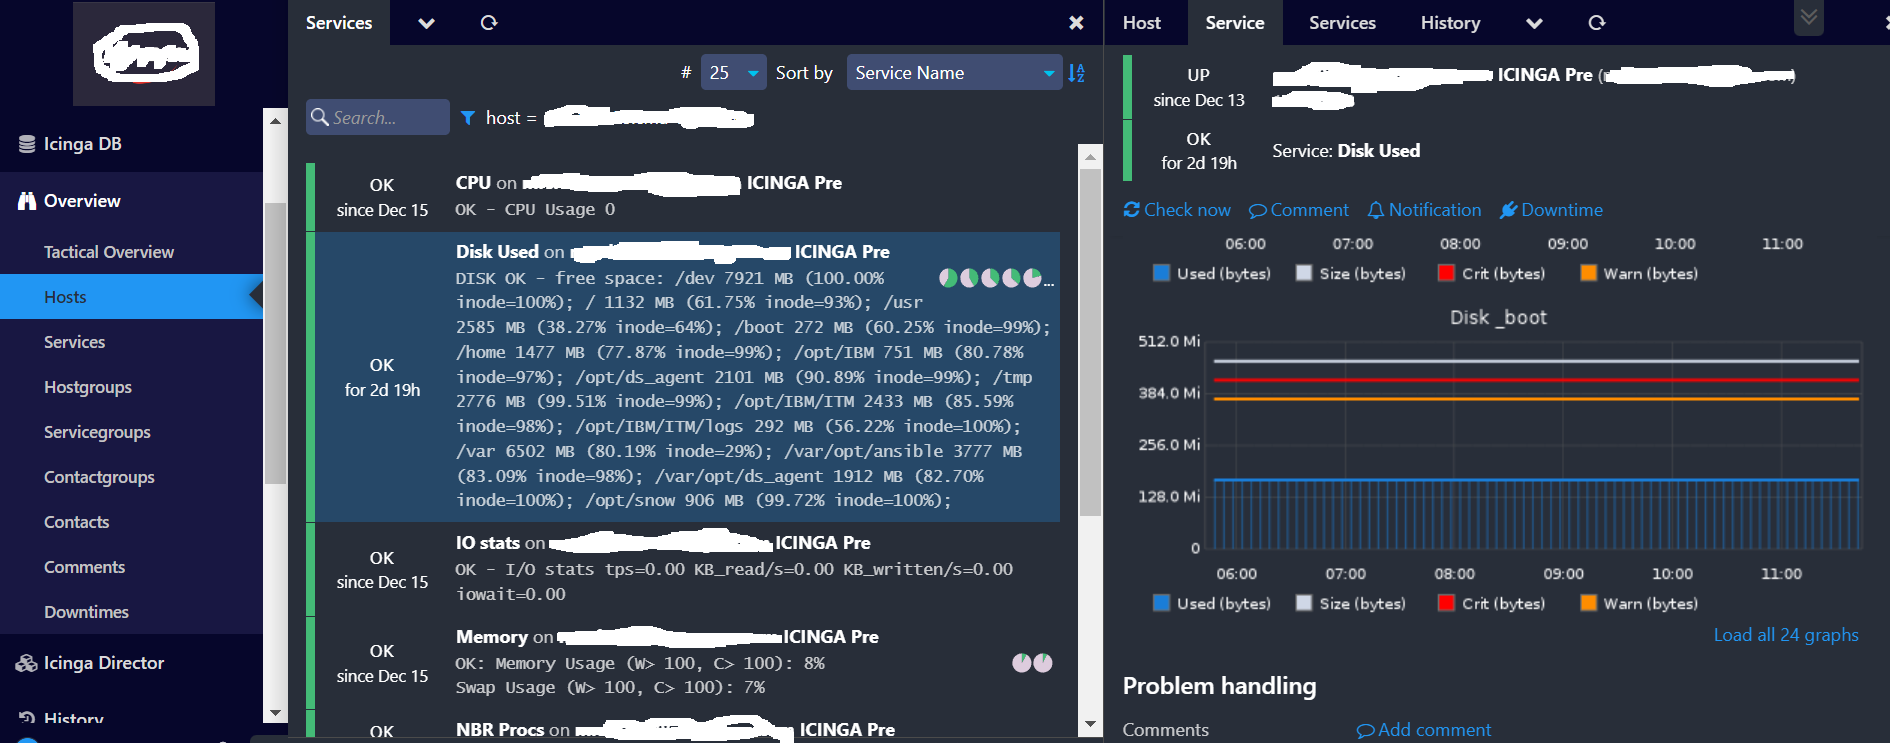
With “Overview/Hosts” when I click of the link “Load all NumberGrap graphs” I see all the graphs corresponding to the service viewed. The link is : https://Icinga2Master/graphite/list/services?host=HostName.Domaine.com&service=Disk%20Space&graphs_limit=-1
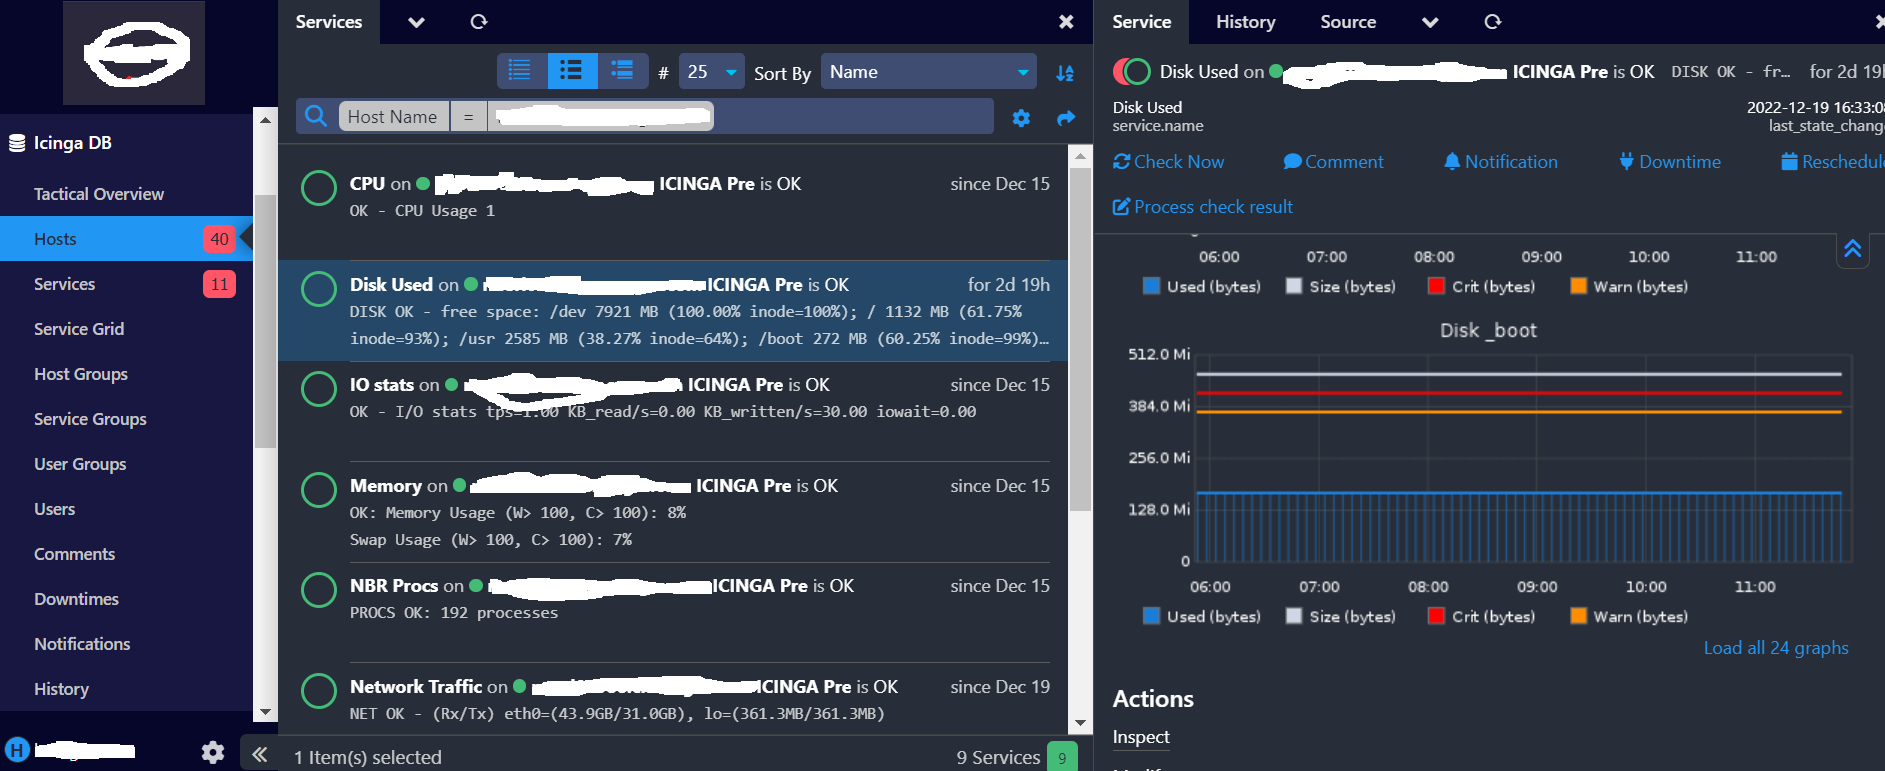
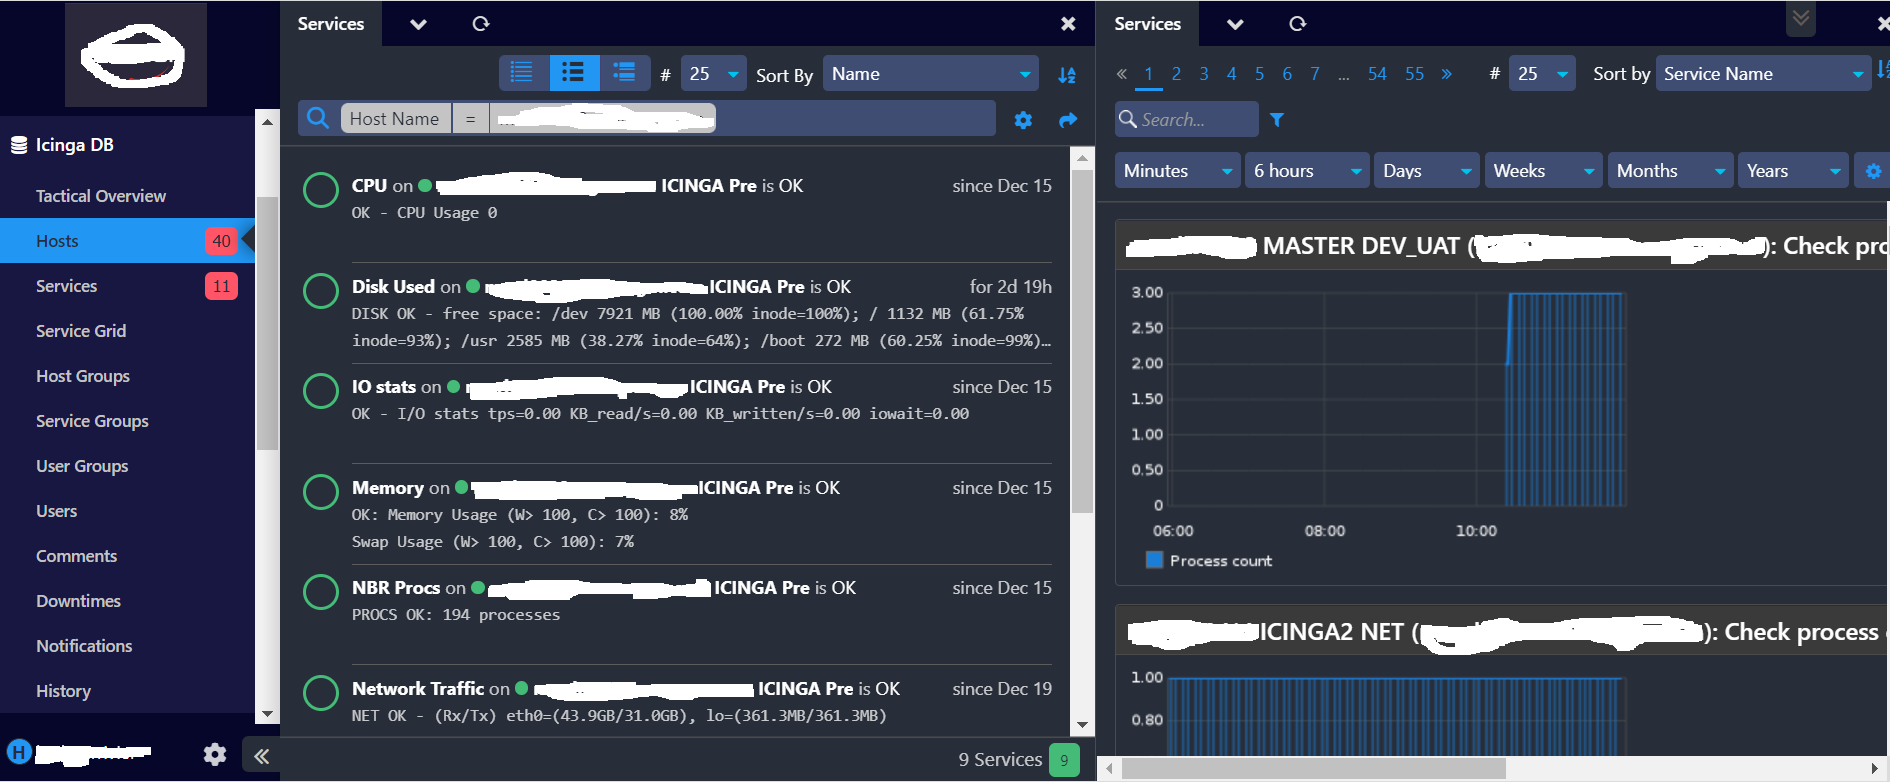
But, with icingadb/Hosts, I see all existing graphs. The link is : https://icinga2Master/graphite/services?service.name=Disk%20Space&host.name=HostName.Domaine.com&graphs_limit=-1
Thanks