I finally made it through all the errors in the gui wizard
when I log in to the web interface I get this
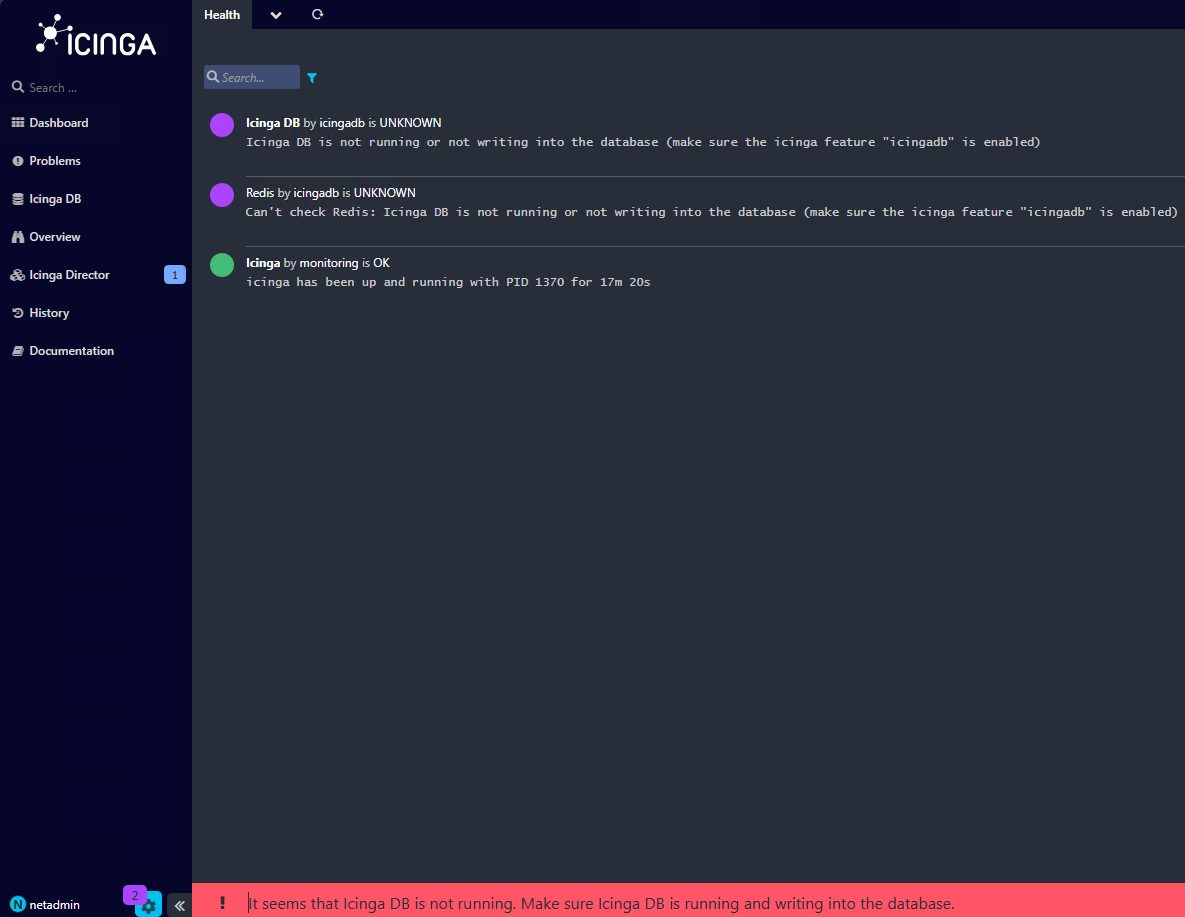
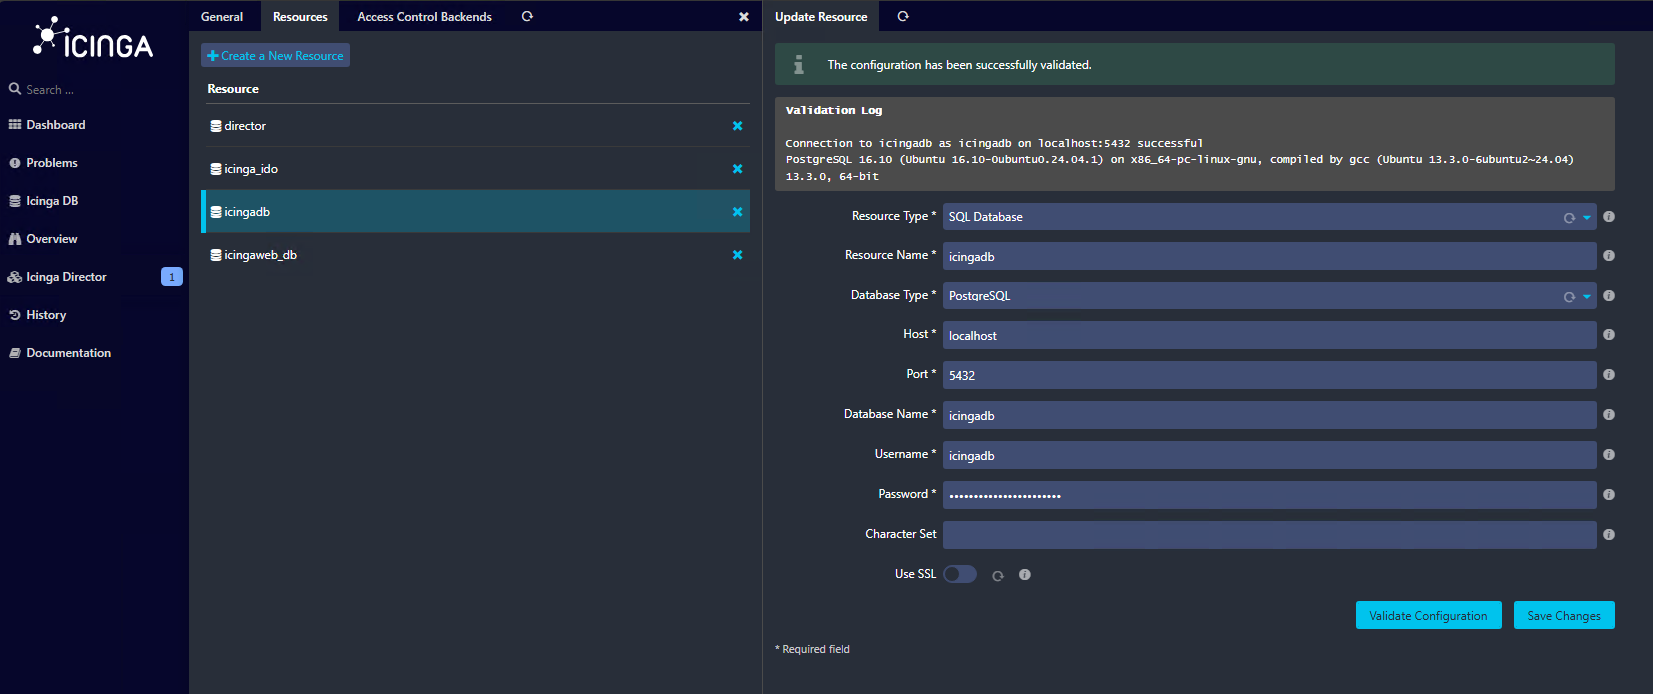
seems weird because I validated configuration for different databases numerous times during the wizard
I do see this but I am unable to determine what module or ??? is not able to connect
netadmin@monitor:~$ sudo -i
[sudo] password for netadmin:
root@monitor:~# systemctl enable --now icingadb
root@monitor:~# systemctl status icingadb
● icingadb.service - Icinga DB
Loaded: loaded (/usr/lib/systemd/system/icingadb.service; enabled; preset: enabled)
Active: active (running) since Thu 2025-09-25 14:50:13 UTC; 4min 48s ago
Main PID: 1304 (icingadb)
Tasks: 6 (limit: 14258)
Memory: 12.7M (peak: 13.1M)
CPU: 22ms
CGroup: /system.slice/icingadb.service
└─1304 /usr/sbin/icingadb --config /etc/icingadb/config.yml
Sep 25 14:50:13 monitor systemd[1]: Started icingadb.service - Icinga DB.
Sep 25 14:50:13 monitor icingadb[1304]: Connecting to database at ‘mysql://icingadb@localhost:5432/icingadb’
Sep 25 14:51:13 monitor icingadb[1304]: database: [packets.go:58 unexpected EOF]
Sep 25 14:51:13 monitor icingadb[1304]: database: Can’t connect to database. Retrying error=“invalid connection”
Sep 25 14:52:13 monitor icingadb[1304]: database: [packets.go:58 unexpected EOF]
Sep 25 14:52:13 monitor icingadb[1304]: database: Can’t connect to database. Retrying error=“invalid connection”
Sep 25 14:53:13 monitor icingadb[1304]: database: [packets.go:58 unexpected EOF]
Sep 25 14:53:13 monitor icingadb[1304]: database: Can’t connect to database. Retrying error=“invalid connection”
Sep 25 14:54:14 monitor icingadb[1304]: database: [packets.go:58 unexpected EOF]
Sep 25 14:54:14 monitor icingadb[1304]: database: Can’t connect to database. Retrying error=“invalid connection”
I see this below in one of the logs but unsure what to do with it
thanks for your patience with me and your help and time
[2025-09-25 10:55:36 -0500] information/ApiListener: ‘api’ started.
[2025-09-25 10:55:36 -0500] information/ApiListener: Started new listener on ‘[::]:5665’
[2025-09-25 10:55:36 -0500] information/DbConnection: ‘ido-pgsql’ started.
[2025-09-25 10:55:36 -0500] information/IcingaDB: ‘icingadb’ started.
[2025-09-25 10:55:36 -0500] information/NotificationComponent: ‘notification’ started.
[2025-09-25 10:55:36 -0500] information/CheckerComponent: ‘checker’ started.
[2025-09-25 10:55:36 -0500] information/ConfigItem: Activated all objects.
[2025-09-25 10:55:36 -0500] information/IdoPgsqlConnection: ‘ido-pgsql’ resumed.
[2025-09-25 10:55:36 -0500] information/DbConnection: Resuming IDO connection: ido-pgsql
[2025-09-25 10:55:36 -0500] information/IcingaDB: Trying to connect to Redis server (async) on host ‘127.0.0.1:6380’
[2025-09-25 10:55:36 -0500] information/IcingaDB: Connected to Redis server
[2025-09-25 10:55:36 -0500] information/IcingaDB: Starting initial config/status dump
[2025-09-25 10:55:36 -0500] information/IdoPgsqlConnection: PGSQL IDO instance id: 1 (schema version: ‘1.14.3’)
[2025-09-25 10:55:36 -0500] information/IcingaDB: Initial config/status dump finished in 0.0997579 seconds.
[2025-09-25 10:55:36 -0500] information/IdoPgsqlConnection: Finished reconnecting to ‘ido-pgsql’ database ‘icinga2’ in 0.139461 second(s).
[2025-09-25 10:55:46 -0500] information/WorkQueue: #6 (ApiListener, RelayQueue) items: 0, rate: 0.233333/s (14/min 14/5min 14/15min);
[2025-09-25 10:55:46 -0500] information/WorkQueue: #7 (ApiListener, SyncQueue) items: 0, rate: 0/s (0/min 0/5min 0/15min);
[2025-09-25 10:55:46 -0500] information/IdoPgsqlConnection: Pending queries: 2 (Input: 3/s; Output: 3/s)
[2025-09-25 10:55:46 -0500] information/IcingaDB: Pending queries: 0 (Input: 1/s; Output: 1/s)
[2025-09-25 10:58:02 -0500] information/Checkable: Checkable ‘monitor!procs’ has 1 notification(s). Checking filters for type ‘Problem’, sends will be logged.
[2025-09-25 10:58:02 -0500] information/Notification: Sending ‘Problem’ notification ‘monitor!procs!mail-icingaadmin’ for user ‘icingaadmin’
[2025-09-25 10:58:02 -0500] information/Notification: Completed sending ‘Problem’ notification ‘monitor!procs!mail-icingaadmin’ for checkable ‘monitor!procs’ and user ‘icingaadmin’ using command 'mail-serv>
[2025-09-25 10:58:02 -0500] warning/PluginNotificationTask: Notification command for object ‘monitor!procs’ (PID: 1908, arguments: ‘/etc/icinga2/scripts/mail-service-notification.sh’ ‘-4’ ‘127.0.0.1’ ‘-6’ >
[2025-09-25 11:00:36 -0500] information/ConfigObject: Dumping program state to file ‘/var/lib/icinga2/icinga2.state’
[2025-09-25 11:00:46 -0500] information/WorkQueue: #6 (ApiListener, RelayQueue) items: 0, rate: 0.966667/s (58/min 283/5min 297/15min);
[2025-09-25 11:00:46 -0500] information/WorkQueue: #7 (ApiListener, SyncQueue) items: 0, rate: 0/s (0/min 0/5min 0/15min);
[2025-09-25 11:00:46 -0500] information/IcingaDB: Pending queries: 0 (Input: 1/s; Output: 1/s)
[2025-09-25 11:00:56 -0500] information/IdoPgsqlConnection: Pending queries: 0 (Input: 4/s; Output: 4/s)
[2025-09-25 11:01:54 -0500] information/Checkable: Checkable ‘monitor!procs’ has 1 notification(s). Checking filters for type ‘Recovery’, sends will be logged.
[2025-09-25 11:01:54 -0500] information/Notification: Sending ‘Recovery’ notification ‘monitor!procs!mail-icingaadmin’ for user ‘icingaadmin’
[2025-09-25 11:01:54 -0500] information/Notification: Completed sending ‘Recovery’ notification ‘monitor!procs!mail-icingaadmin’ for checkable ‘monitor!procs’ and user ‘icingaadmin’ using command 'mail-ser>
[2025-09-25 11:01:54 -0500] warning/PluginNotificationTask: Notification command for object ‘monitor!procs’ (PID: 2125, arguments: ‘/etc/icinga2/scripts/mail-service-notification.sh’ ‘-4’ ‘127.0.0.1’ ‘-6’ >
[2025-09-25 11:05:36 -0500] information/ConfigObject: Dumping program state to file ‘/var/lib/icinga2/icinga2.state’
[2025-09-25 11:05:46 -0500] information/WorkQueue: #7 (ApiListener, SyncQueue) items: 0, rate: 0/s (0/min 0/5min 0/15min);
[2025-09-25 11:05:46 -0500] information/WorkQueue: #6 (ApiListener, RelayQueue) items: 0, rate: 0.933333/s (56/min 269/5min 572/15min);
[2025-09-25 11:05:46 -0500] information/IcingaDB: Pending queries: 0 (Input: 3/s; Output: 3/s)
[2025-09-25 11:05:56 -0500] information/IdoPgsqlConnection: Pending queries: 0 (Input: 3/s; Output: 3/s)
[2025-09-25 11:10:36 -0500] information/ConfigObject: Dumping program state to file ‘/var/lib/icinga2/icinga2.state’
[2025-09-25 11:10:46 -0500] information/WorkQueue: #6 (ApiListener, RelayQueue) items: 0, rate: 0.866667/s (52/min 256/5min 814/15min);
[2025-09-25 11:10:46 -0500] information/WorkQueue: #7 (ApiListener, SyncQueue) items: 0, rate: 0/s (0/min 0/5min 0/15min);
[2025-09-25 11:10:46 -0500] information/IcingaDB: Pending queries: 0 (Input: 2/s; Output: 2/s)
[2025-09-25 11:10:56 -0500] information/IdoPgsqlConnection: Pending queries: 0 (Input: 4/s; Output: 4/s)