mpastor
February 26, 2019, 8:23pm
1
Hi,
I have a problem with some metrics stored in Graphite.
Icinga send performance data correctly but it doesn’t show metrics in Icinga Web.
Checking Graphite (port 8080) I can see all metrics.
Could it be because of metric names (very long)?
icinga2.hostname_domain_local.services.Health:_Elastic_Search_Active.check_elasticsearch_key.perfdata.thread_pool.search.queue
Compared to other metric working:
icinga2.hostname_domain_local.services.Disk:_dev__sda1.disk.perfdata.
Versions:
Thanks!
ArMar87
February 27, 2019, 4:09pm
2
Hi,
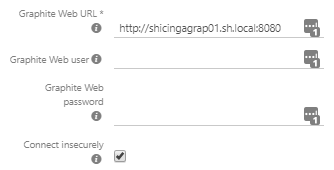
can you show us the configuration of the graphite backend?
BR
ArMar87
February 28, 2019, 1:13pm
4
Hi,
I have rechecked my checks and there are longer metric names and they are working like they should.
Do you setup templates different to the default?
BR
mpastor
February 28, 2019, 3:14pm
5
Here is requested command output:
Object ‘graphite’ of type ‘GraphiteWriter’:
__name = “graphite”
enable_send_metadata = false
enable_send_thresholds = true
host = “192.168.177.160”
host_name_template = “icinga2.$host.name$.host.$host.check_command$”
name = “graphite”
package = “_etc”
port = “2003”
service_name_template = “icinga2.$host.name$.services.$service.name$.$service.check_command$”
source_location
first_column = 1
first_line = 8
last_column = 32
last_line = 8
path = “/etc/icinga2/features-enabled/graphite.conf”
templates = [ “graphite” ]
type = “GraphiteWriter”
zone = “”
Regarding ‘:’, don’t think is the issue as other metrics are shown correctly.
/Marcos
mpastor
February 28, 2019, 3:19pm
6
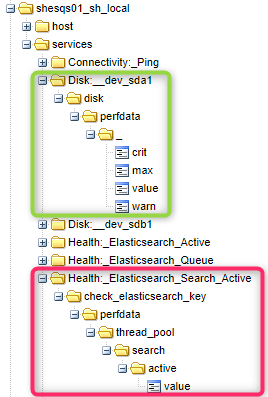
Here is detailed path to metrics:
Green one is working while red one is not.
But both can be viewed in Graphite directly (or even in Grafana using Graphite as source).
/Marcos
ArMar87
March 1, 2019, 8:22am
7
Hi,
it looks like an issue with the Label of the performance data but thats just a guess.
Could you change it to something without “.”? Maybe that will work.
BR
mpastor
March 1, 2019, 10:45am
8
Hi,
I’m quite sure is related with string after “perfdata”. A single string without “.” works but if string has “.” then issue occurs.
perfdata._
I’ll try to modify plugin output and see if it makes any difference.
But question is, does Icinga Web have to manage this correctly even having “.” in perfdata string?
Thanks!
Please show the plugin call on the command line (input and output).
mpastor
March 4, 2019, 5:22pm
10
Hi Wolfgang,
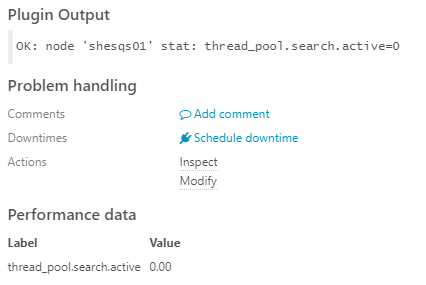
/usr/lib/nagios/plugins/harisekhon/check_elasticsearch_node_stats2.pl -H shes21 -N shes21.sh.local -K thread_pool.search.active
OK: node ‘shes21.sh.local’ stat: thread_pool.search.active=0 | ‘thread_pool.search.active’=0;;;
/Marcos
The label is enclosed in apostrophes so it should be taken as one string. It might be a bug of Graphite (?).
log1c
March 5, 2019, 7:19am
12
If it is due to the single quote in the perf data output you could try this fix for the graphite module:
Also you can add &graph_debug=1 to the URL to get a detailed debug log from the graphite module.
What I also needed to do to display all my graphs was setting the icinga_ido resource character set to “latin1”
1 Like
mpastor
October 1, 2019, 1:58pm
13
At the end it was related with dots.
I changed perf data output “thread_pool.search.active” to “thread_pool_search_active” and it starts working.
Sorry for late response.
/Marcos