Hi,
long time ago I was using PNP4Nagios and it had a nice feature for the graphs, displaying current/min/max/avg values below the graph. Is something similar possible with graphite templates?
Thanks everyone!
Hi,
long time ago I was using PNP4Nagios and it had a nice feature for the graphs, displaying current/min/max/avg values below the graph. Is something similar possible with graphite templates?
Thanks everyone!
Hello and welcome,
with Grafana you can easily put legends under/beside your graphs. Dont know if it is possible with the Graphite module. Maybe @nilmerg or @elippmann can tell more.
Regards,
Carsten
Hi.
This is possible.
Here an example for the “load” service:
# path to templates: /etc/icingaweb2/modules/graphite/templates/

[load.graph]
check_command = "load"

[load.metrics_filters]
load15.value = "$service_name_template$.perfdata.load15.value"
load5.value = "$service_name_template$.perfdata.load5.value"
load1.value = "$service_name_template$.perfdata.load1.value"

[load.urlparams]
areaAlpha = "0.5"
min = "0"
yUnitSystem = "none"
lineWidth = "2"

[load.functions]
load15.value = "alias(color($metric$, '#ff5566'), 'Load 15')"
load5.value = "alias(color($metric$, '#ffaa44'), 'Load 5')"
load1.value = "alias(color($metric$, '#44bb77'), 'Load 1')"
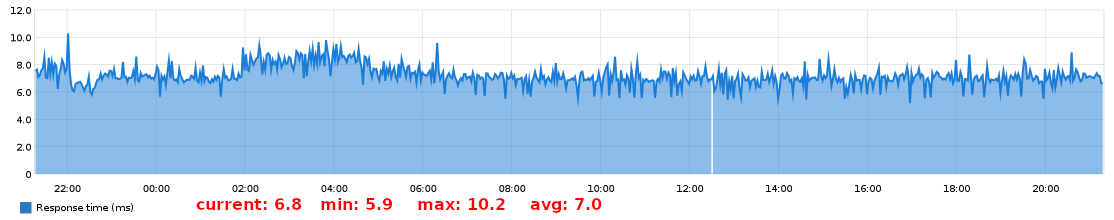
The interesting part is [load.functions]
Load 15, Load 5 and Load 1 are the legends.
In the example, also the color gets customized.
![]()
Greetings.
Hey,
thanks for the replies! I already had a look at the load template but I am looking for something different. I want to include some values (current/min/max/avg) into the legend but it seems I am only able to use $metric$ within the value definition, is this correct?