hello,
I’m using iftraffic64 plugin in Icinga2 and Grafana for visualization.
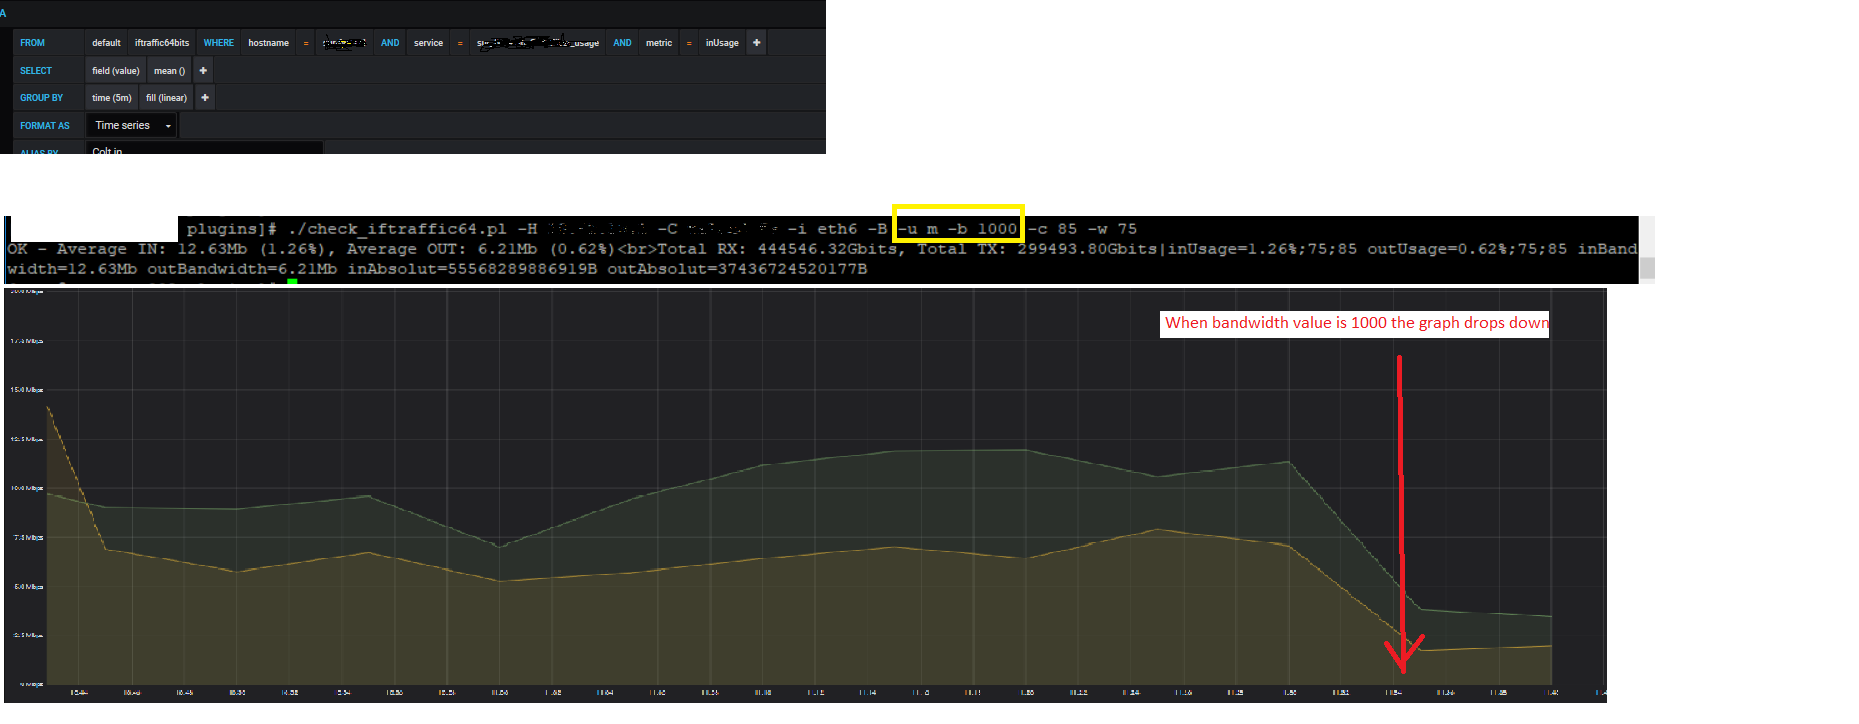
when i use the bandwidth option (-b or -I and -u with m for megabits ) with values that are above 200 like 1000 for 1 gigabits circuit (i also tried -u g with value 1) i get a graph that is 10 times lower that it should be.
But if i use bandwidth values under 200 , i get the right graphic values. Does anyone had this issue and fixed it ?
I don’t understand why bandwidth option (value>200) has any effect on the graph, because the average IN and average OUT plugin output values are correct.
Hi,
better user nwc_health which deals correct with UOMs and interface speed.
Regards,
Carsten
Hello Carsten,
That was an option, i’ll give it a try, thank you.
Br
Abderrazak
I would prefer nwc_health too, but keep in mind that nwc has a high footprint and so can harm your performance if you have alot of checks. I have more then 5000 checks with nwc and i need to deploy more satellites to not get a lot of timeouts.
For iftraffic64 it looks like --bits switch is broken and if you use other values than bytes perofomancdata maybe wrong. Still testing it here with bytes.
No need for satellites, command_endpoint defined via variable in hostobject is your friend if you need a worker to do it ![]()
1 Like
nwc_health works great !
Thank you all.
Abderrazak