Hi,
I am monitoring network devices with the check_interfaces plugin. Perfdata is correctly collected and the graphite backend is drawing graphs. However, I cannot get icingaweb2 to correctly render the graphs in the WebUI. After troubleshooting this today, I’m sure I’m getting closer to the issue but am not sure how to fix it 
When opening the graph URL with graph_debug, the following debug message is shown:
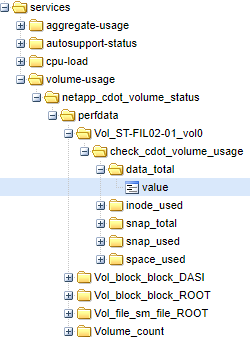
+++ Fetched 0 metric(s) from 'http://hostname/metrics/expand?query=icinga2.qfx5100-01.services.junos-interfaces-qfx.interfaces.perfdata.%2A.value'
That URL indeed does not deliver any data. With some tinkering, I found that this URL output the exact data that I was looking for:
http://hostname/metrics/expand?query=icinga2.qfx5100-01.services.junos-interfaces-qfx.interfaces.perfdata.*.check_snmp.*.value
The first wildcard is the interface to be monitored, and the second wildcard is the monitored property (interface throughput, errors etc.). How do I get Icingaweb2 to look in the correct place? It’s probably something to do with “vars.service_name_template” in the service configuration but I can’t quite figure out how to wrangle it so it does what I want it to do.
Graphs (memory, disk, load etc) on other hosts are rendered correctly in Icingaweb2.
Any help appreciated!
Service snippet:
    apply Service "junos-interfaces-qfx" {
      import "generic-service"
      check_command = "interfaces"
      vars.check_command = "interfaces"
      vars.interfaces_regex = "(^ge-*|xe-*)"
      vars.interfaces_names = 1
      assign where host.vars.snmp_community != "" && host.vars.os == "junos" && host.vars.model == "qfx"
    }
Host snippet:
      import "generic-host"
      address = "10.10.10.10"
      vars.os = "junos"
      vars.model = "qfx"
      vars.type = "network"
      vars.snmp_community = "blahfasel"
      vars.interfaces_community = "blahfasel"
    }
/etc/icingaweb2/modules/graphite/interfaces.ini (stolen and adapted from an existing template):
    [interfaces-traffic.graph]
    check_command = "interfaces"

    [interfaces-traffic.metrics_filters]
    bpsin = "$service_name_template$.perfdata.$interface$.check_snmp.inOctets.value"
    bpsout = "$service_name_template$.perfdata.$interface$.check_snmp.outOctets.value"
    [interfaces-traffic.urlparams]
    min = "0"
    title = "Interface $interface$"
    lineWidth = "2"
    yUnitSystem = "si"

    [interfaces-traffic.functions]
    bpsin = "alias(color($metric$, '#1a7dd7'), 'Traffic in (B/s)')"
    bpsout = "alias(color($metric$, '#0b3c68'), 'Traffic out (B/s)')"

