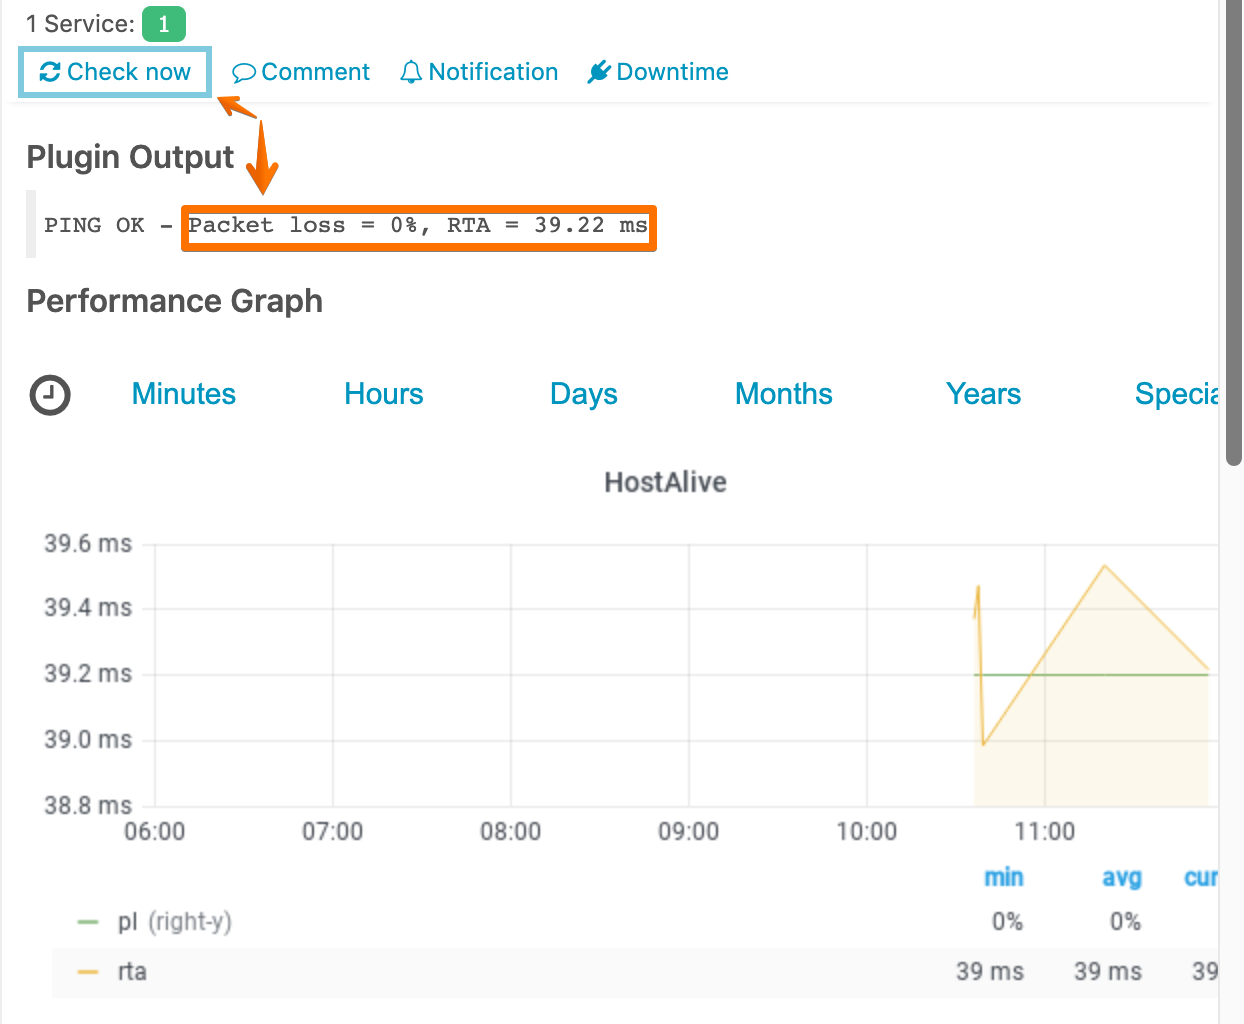
Default hostalive host check command returns no data fro PL and RTA - only “PING OK”.
When I pressing Check now - I receiving PING OK with statistic.
After that action some hosts alive checks will return ping with data, but others - returns to previous “PING OK” state.
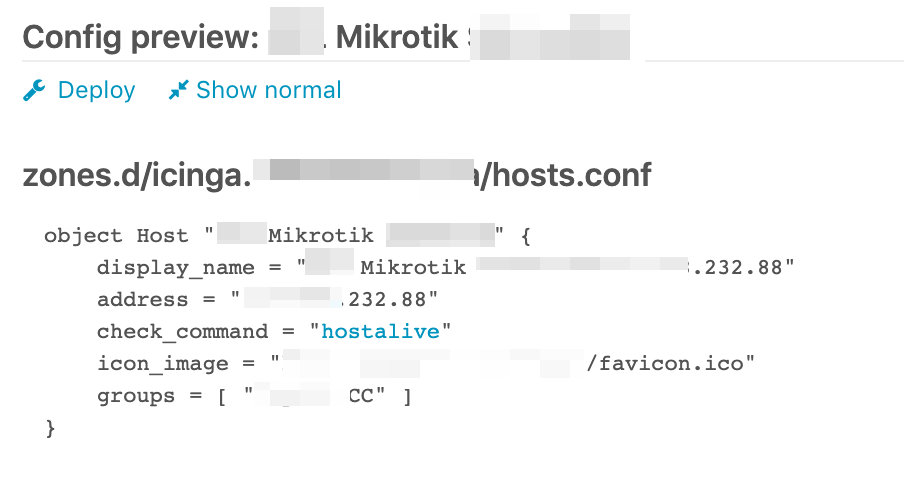
Host config
My system running on Debian 10 Buster
Icinga Web 2 Version
2.7.3
Git commit
06cabfe8ba28cf545a42c92f25484383191a4e51
PHP Version
7.3.14-1~deb10u1
Git commit date
2019-10-18
| Name |
Version |
| director |
master |
| doc |
2.7.3 |
| grafana |
1.3.6 |
| graphite |
0.0.0 |
| incubator |
0.5.0 |
| ipl |
v0.5.0 |
| monitoring |
2.7.3 |
| reactbundle |
0.7.0 |
icinga2 - The Icinga 2 network monitoring daemon (version: r2.11.3-1)
Hello,
check you inspect link and you will see what command icinga runs for the hostalive check. maybe the command has changed…
Regards,
Carsten
Did you mean this place?
BTW, when I do check manually, the result is full
(…/director/hosts/templates?command=hostalive)
This is an external object. It has been imported from Icinga 2 through the Core API and cannot be managed with the Icinga Director. It is however perfectly valid to create objects using this or referring to this object. You might also want to define related Fields to make work based on this object more enjoyable.
object CheckCommand “hostalive” {
import “plugin-check-command”
command = [ PluginDir + “/check_ping” ]
timeout = 1m
arguments += {
“-H” = {
description = “host to ping”
value = “$ping_address$”
}
“-c” = {
description = “critical threshold pair”
value = “$ping_crta$,$ping_cpl$%”
}
“-p” = {
description = “number of ICMP ECHO packets to send (Default: 5)”
value = “$ping_packets$”
}
“-t” = {
description = “Seconds before connection times out (default: 10)”
value = “$ping_timeout$”
}
“-w” = {
description = “warning threshold pair”
value = “$ping_wrta$,$ping_wpl$%”
}
}
vars.check_address = {
arguments = [ ]
deprecated = false
name = “”
side_effect_free = false
type = “Function”
}
vars.check_ipv4 = false
vars.check_ipv6 = false
vars.ping_address = “$check_address$”
vars.ping_cpl = 100
vars.ping_crta = 5000
vars.ping_wpl = 80
vars.ping_wrta = 3000
}
Hello,
i did not ask about the command definition. You should check what command icinga is executing. You can either use the inspect link or enable debug log.
Regards,
Carsten
1 Like
Sorry, I never used “Inspect” link and it was hard to find it - looked for blue color links and missed this)
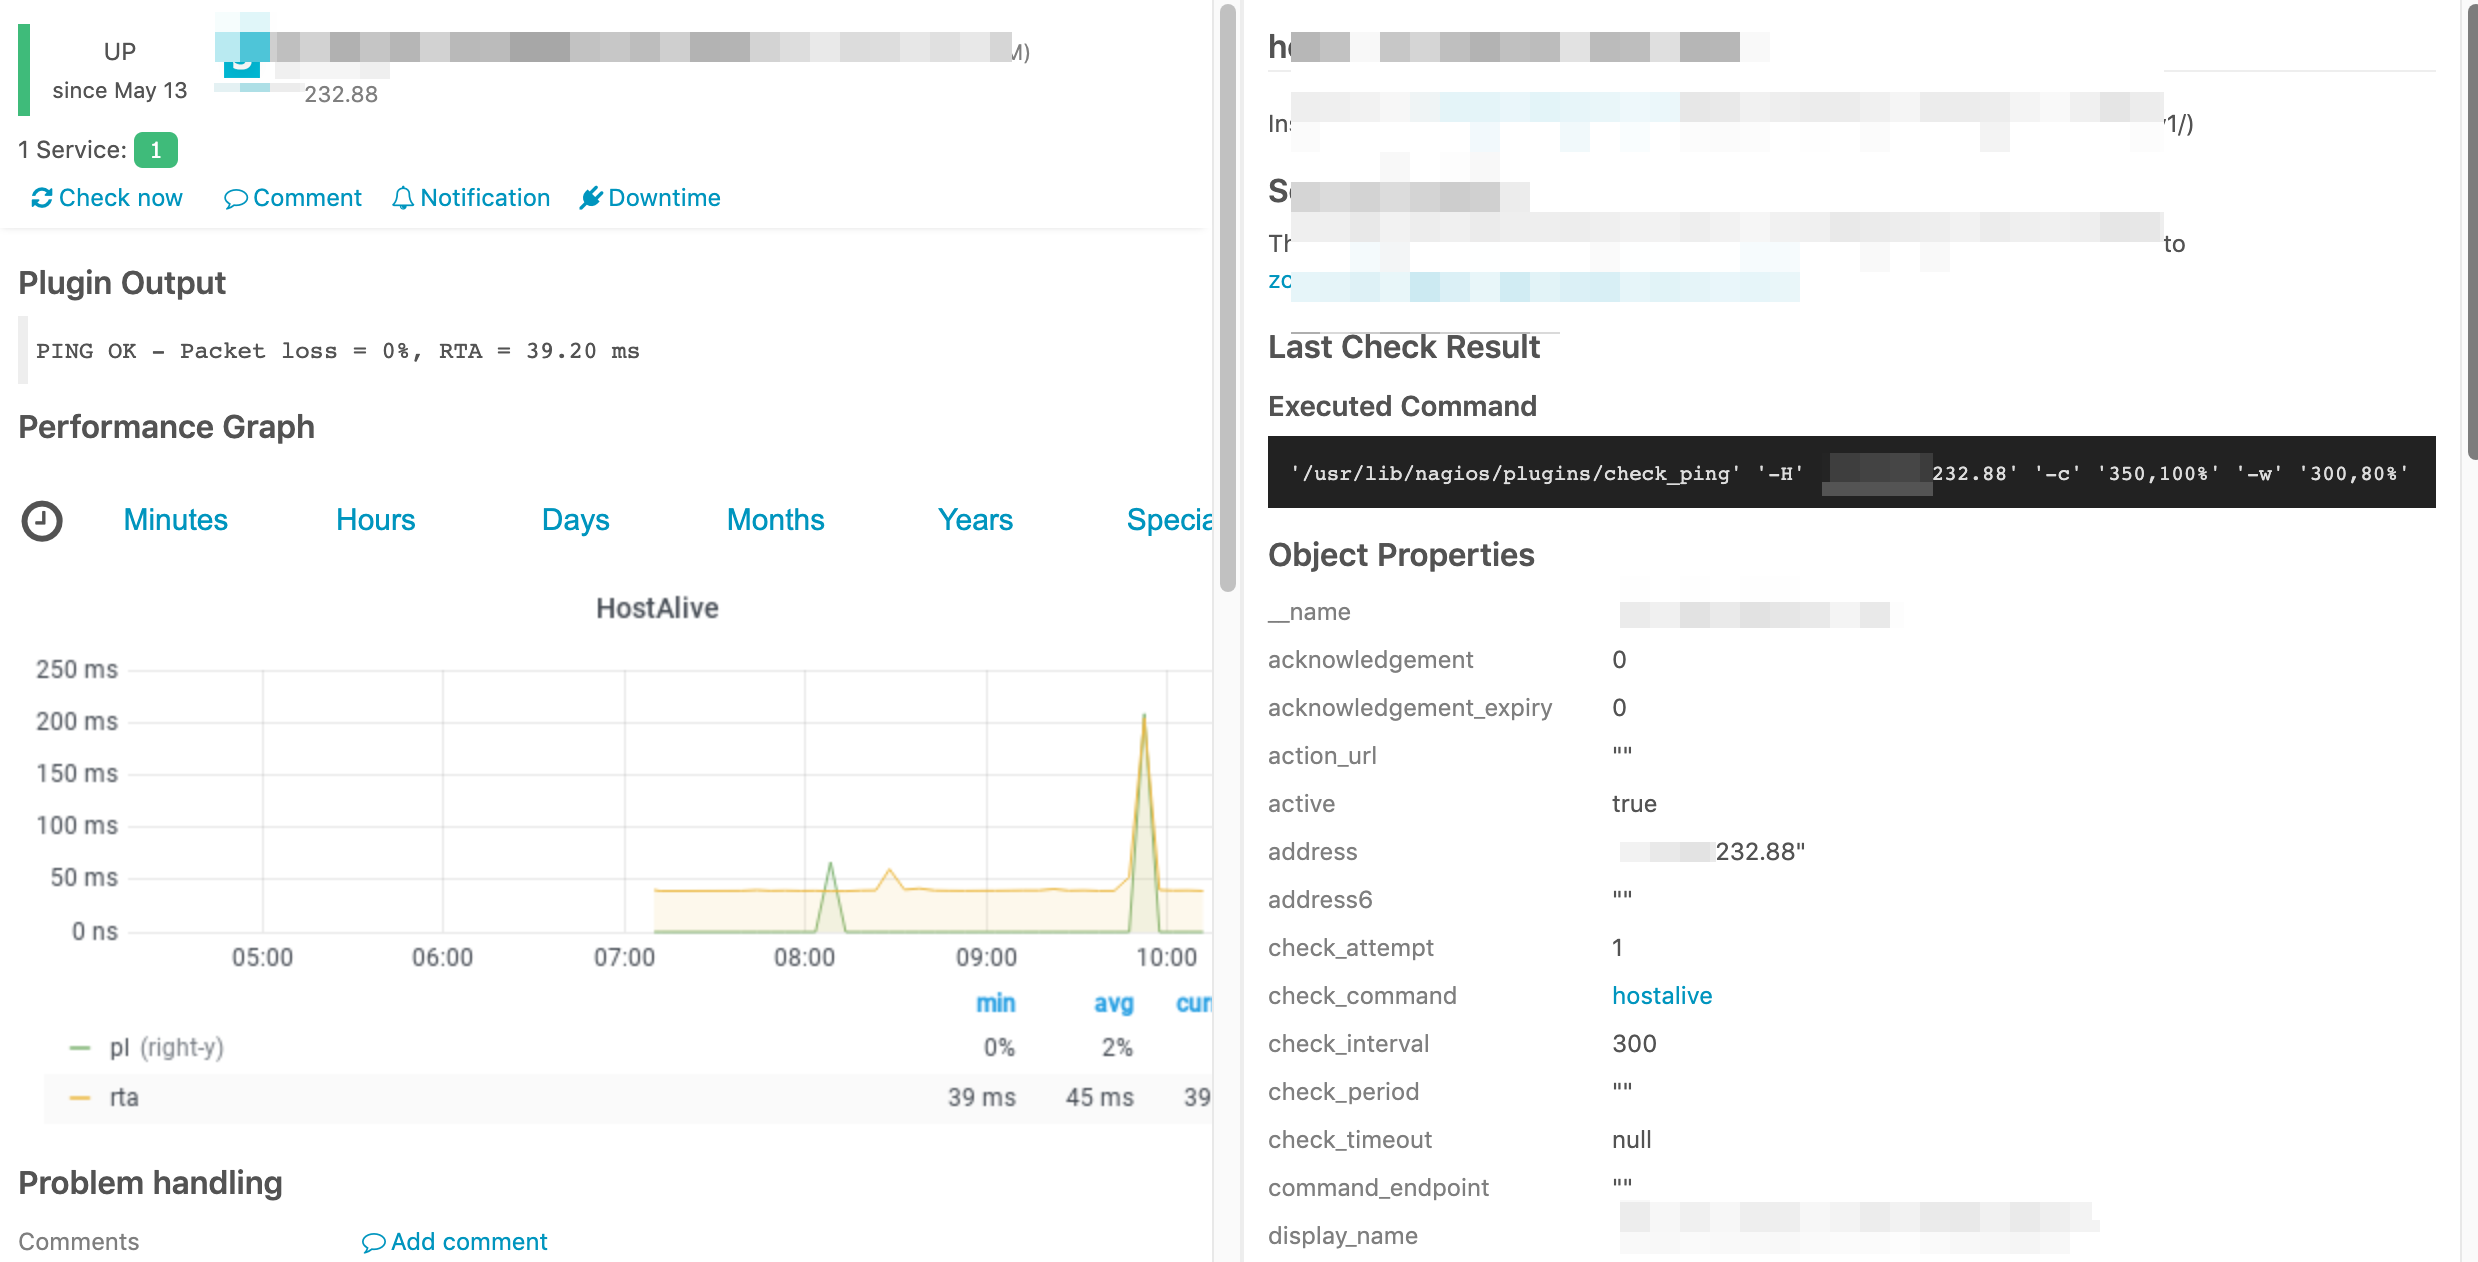
So, the problem is empty executed command (
and it looks ok after manual check
Hi,
empty “executed command” normaly means it has never run. Does it now do the check in the normal interval?
Regards,
Carsten
Does it now do the check in the normal interval?
No, it doesn’t. After manually run “check now” it will receive result, but then automatic check run (or it’s just my opinion and it not running) will clear manual result and I see empty result on the status again.
Do you think I need to check intervals in the template?
UPD: I checked service page right now again and saw that after my last manually check - it executed automatically as normal (with this host for example - but have another such hosts also and still don’t know how it were broken and why it was fixed).
I have a host template with check command “hostalive” - critical/warn settings ‘-c’ ‘350,100%’ ‘-w’ '300,80%
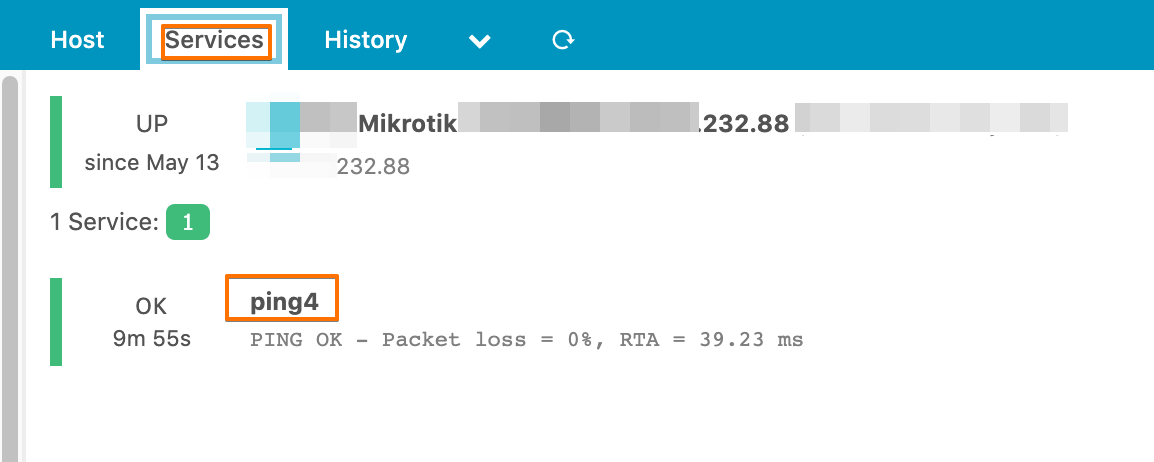
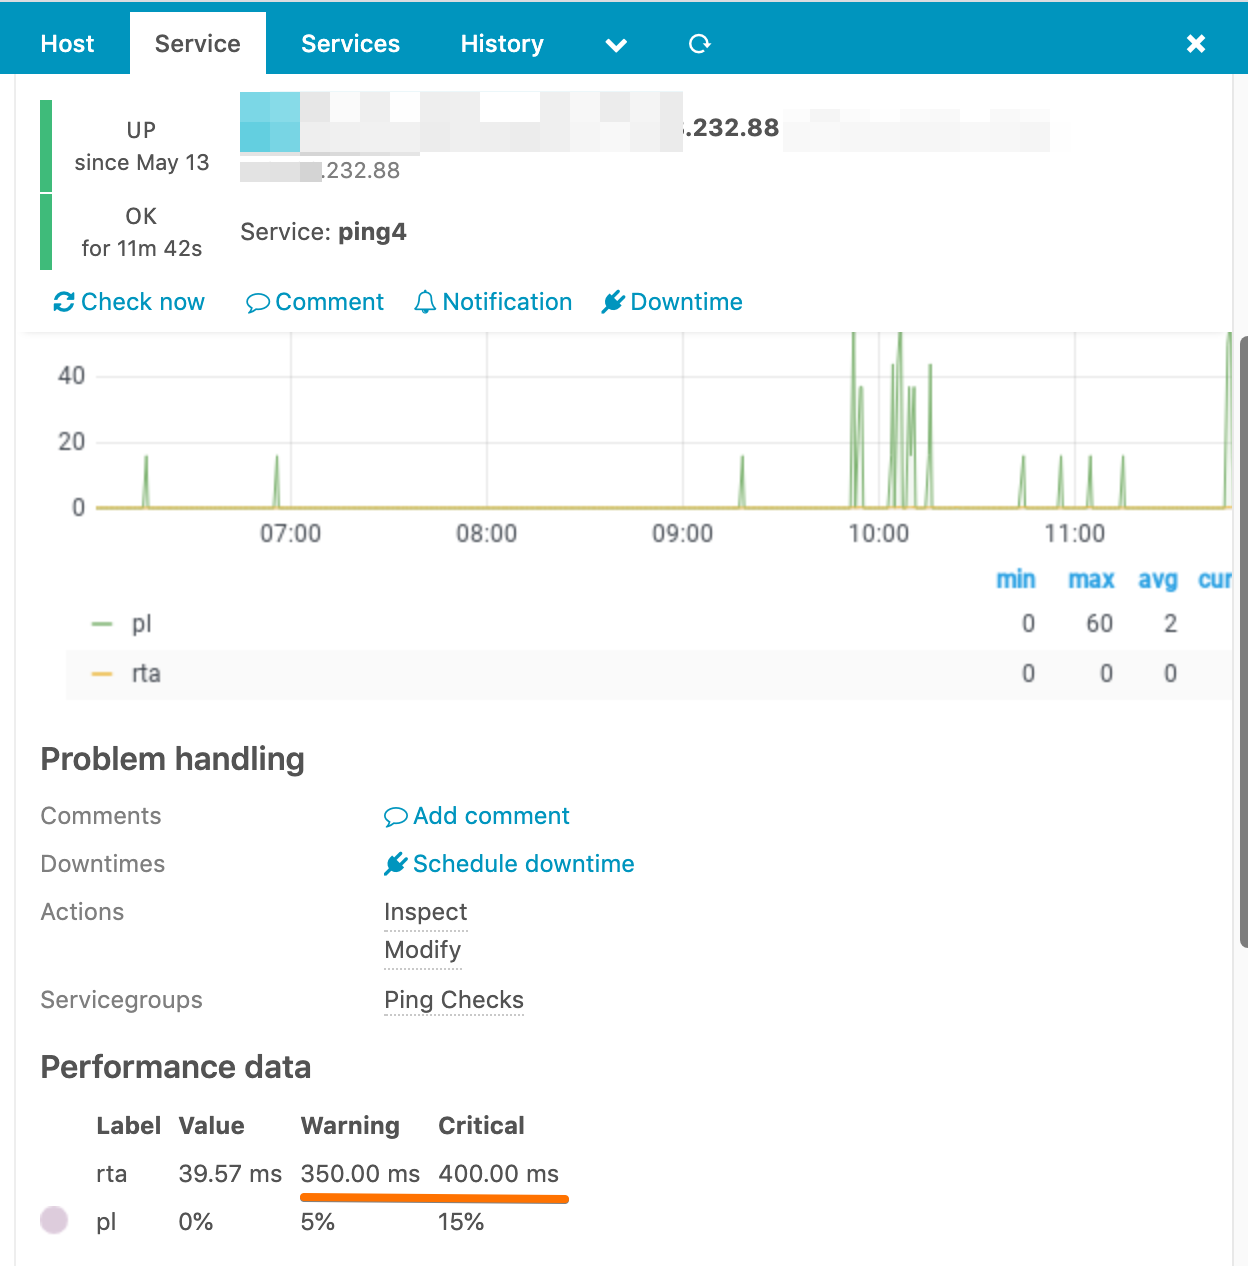
But in the debug for this host IP I can see another ping tests, while there is no any services configured for this host (just template with hostalive) - but I can see ping4 service as a separate service.
Director:
Status:
root@icinga:~# tail -f /var/log/icinga2/debug.log | grep “192.168.232.88”
[2020-06-03 11:49:03 +0000] notice/Process: Running command ‘/usr/lib/nagios/plugins/check_ping’ ‘-H’ ‘192.168.232.88’ ‘-c’ ‘350,100%’ ‘-w’ ‘300,80%’: PID 25949
[2020-06-03 11:49:05 +0000] notice/Process: Running command ‘/usr/lib/nagios/plugins/check_ping’ ‘-4’ ‘-H’ ‘192.168.232.88’ ‘-c’ ‘400,15%’ ‘-w’ ‘350,5%’: PID 25953
[2020-06-03 11:49:07 +0000] notice/Process: PID 25949 (‘/usr/lib/nagios/plugins/check_ping’ ‘-H’ ‘192.168.232.88’ ‘-c’ ‘350,100%’ ‘-w’ ‘300,80%’) terminated with exit code 0
[2020-06-03 11:49:09 +0000] notice/Process: PID 25953 (‘/usr/lib/nagios/plugins/check_ping’ ‘-4’ ‘-H’ ‘192.168.232.88’ ‘-c’ ‘400,15%’ ‘-w’ ‘350,5%’) terminated with exit code 0
[2020-06-03 11:49:20 +0000] notice/Process: Running command ‘/usr/lib/nagios/plugins/check_ping’ ‘-H’ ‘192.168.232.88’ ‘-c’ ‘350,100%’ ‘-w’ ‘300,80%’: PID 25997
[2020-06-03 11:49:24 +0000] notice/Process: PID 25997 (‘/usr/lib/nagios/plugins/check_ping’ ‘-H’ ‘192.168.232.88’ ‘-c’ ‘350,100%’ ‘-w’ ‘300,80%’) terminated with exit code 0
[2020-06-03 11:50:06 +0000] notice/Process: Running command ‘/usr/lib/nagios/plugins/check_ping’ ‘-4’ ‘-H’ ‘192.168.232.88’ ‘-c’ ‘400,15%’ ‘-w’ ‘350,5%’: PID 26147
[2020-06-03 11:50:10 +0000] notice/Process: PID 26147 (‘/usr/lib/nagios/plugins/check_ping’ ‘-4’ ‘-H’ ‘192.168.232.88’ ‘-c’ ‘400,15%’ ‘-w’ ‘350,5%’) terminated with exit code 0
[2020-06-03 11:51:07 +0000] notice/Process: Running command ‘/usr/lib/nagios/plugins/check_ping’ ‘-4’ ‘-H’ ‘192.168.232.88’ ‘-c’ ‘400,15%’ ‘-w’ ‘350,5%’: PID 26402
[2020-06-03 11:51:11 +0000] notice/Process: PID 26402 (‘/usr/lib/nagios/plugins/check_ping’ ‘-4’ ‘-H’ ‘192.168.232.88’ ‘-c’ ‘400,15%’ ‘-w’ ‘350,5%’) terminated with exit code 0
[2020-06-03 11:51:19 +0000] notice/Process: Running command ‘/usr/lib/nagios/plugins/check_ping’ ‘-H’ ‘192.168.232.88’ ‘-c’ ‘350,100%’ ‘-w’ ‘300,80%’: PID 26504
[2020-06-03 11:51:23 +0000] notice/Process: PID 26504 (‘/usr/lib/nagios/plugins/check_ping’ ‘-H’ ‘192.168.232.88’ ‘-c’ ‘350,100%’ ‘-w’ ‘300,80%’) terminated with exit code 0
Could it be some stale schedulers with my old “check command” experiments for this template (and conflict)?