After installing a new server with icingaweb 2.8.2 the Service Problems view ist not usable anymore, if there are a lot of errors. The Web-UI freezes so hard that is even impossible to click something on the left menu. To get the freeze it can be enough to scroll up and down fast enough (but maybe thats the autorefreh). Tested with Firefox and google.
A user with fewer Service Problem is mostly ok.
The user (admin) with the problems has around 400 problems (lot of unknowns)
Other Views like host, which has a loot more informations is completly fine.
Don’t have those problems.
Just checked a system in development, where /icingaweb2/monitoring/list/services?service_problem=1&sort=service_severity&dir=desc has 21 pages with 25 services each (8 crit, mostly unknown or pending) and it works as fas and responsive as other pages.
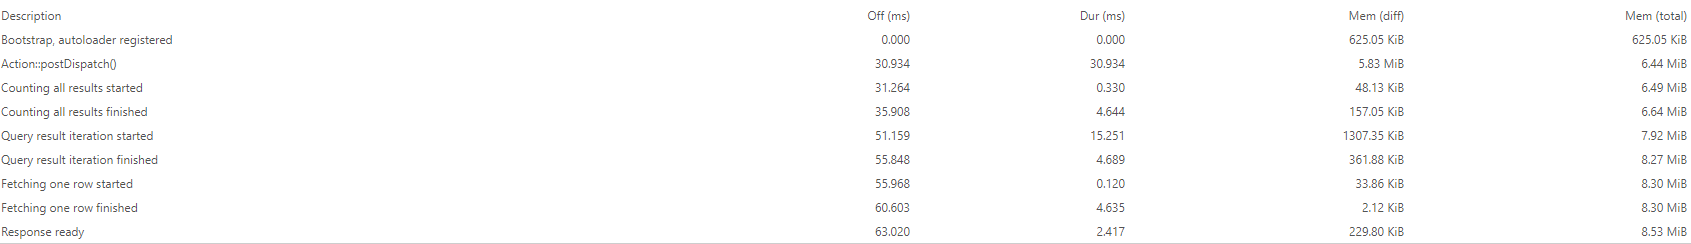
Have you activated the benchmark function of the webinterface? Or tried with the browser console (F12)?
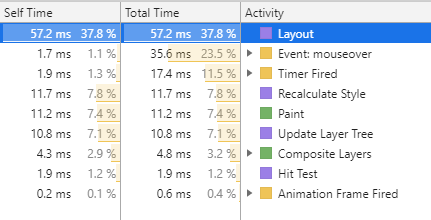
For comparison:
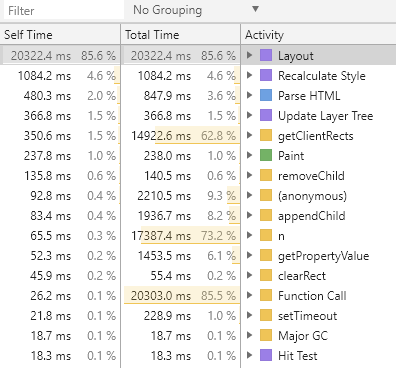
If i limit the view to 25 services its okay. but not on 500 f.e. I even can’t work with the browser console anymore as it stucks.
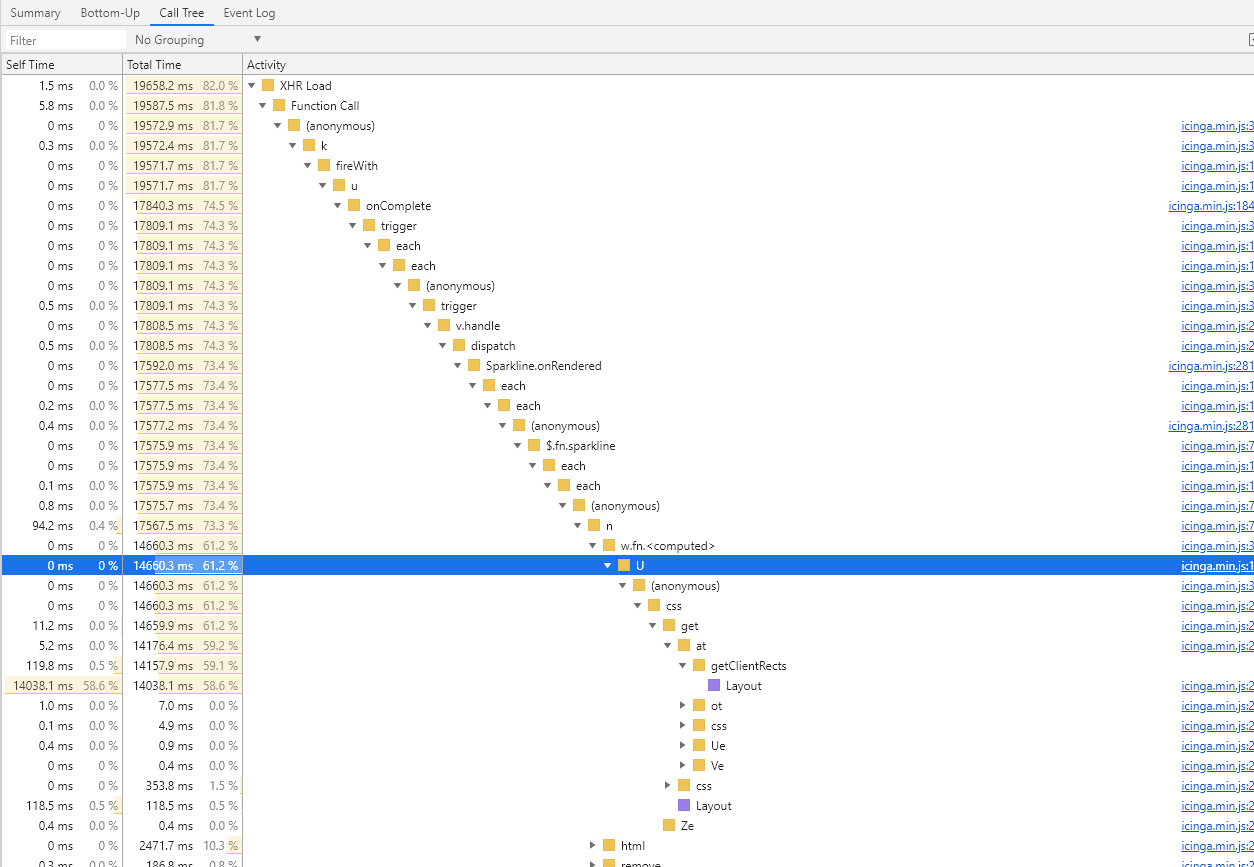
2.8.2:
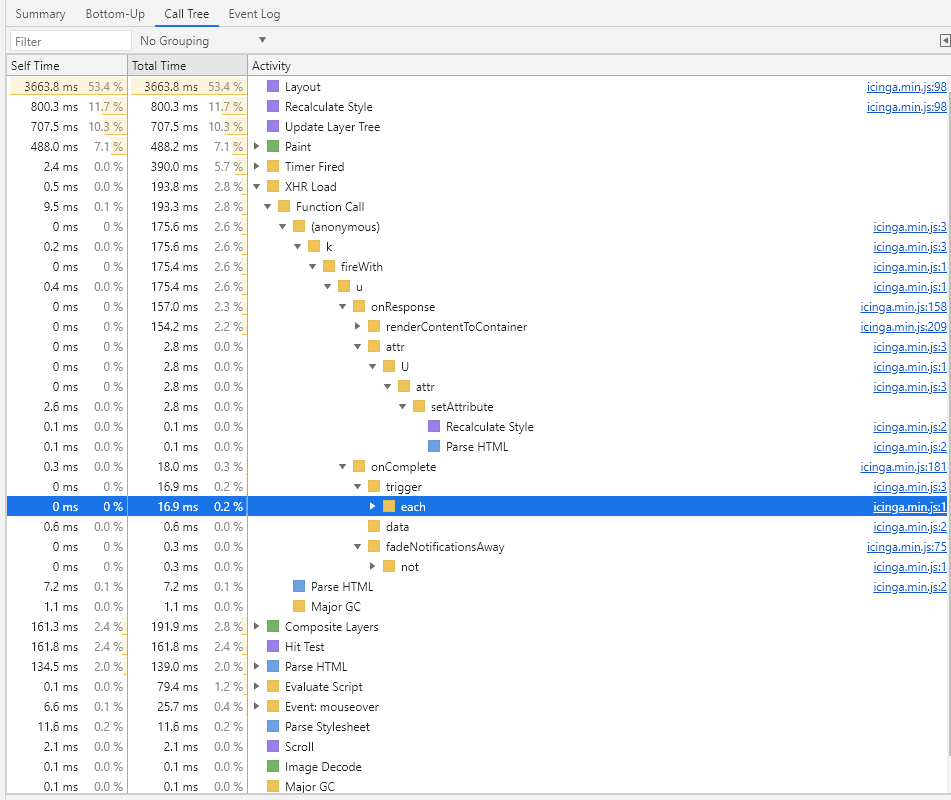
2.7.3:
EDIT: Just Found out, that i have the same Problem, when i go to Overview > Services and select limit 200. up to limit 100 everything is fine. It will not recover unitl reload after i go to limit 200
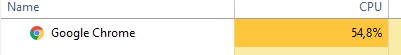
CPU Load of browser is going very high every 5 sec., even if i just have a dashboard open. Its the same on Firefox. With 2.7.4 its max 20%. Could that be a serverside (apache/php) misconfiguration?
This icinga.min.js on 2.7.4 is 537 Lines long. On 2.8.2 its 4651 (!)
I uploaded both icinga.min.js from 2.7.4 and 2.8.1 for comparison. The one of 2.74. is only 537 lines long, the other one is 4651 (!) Not sure if that has anything to do with it, as i have no skills in web things.
The size of the minified JS is not the problem here. But it’s that big because it seems your 2.8.x installation has some additional module which loads a huge dependency in. (CodeMirror)
The actual issue here is that your browser constantly re-renders the page. Looking at the call tree, it’s no wonder why. But it seems pretty exaggerated in your case.
Have you many checks that return percentual performance data? (e.g. Many rows in the service overview with little pie charts?)
The reason why this doesn’t occur with v2.7.4, is probably because we significantly changed the way with v2.8 how Icinga Web 2’s layout works.
there are not many pie charts in the view. I think not more then 5% of the services in the view are rendering pie charts. But some of them have more then 5 pie charts (if i open the service)
I now disabled all modules, but the monitoring modul, the problem is still there.
On my side, every service has an icon configured, thats the only thing which (maybe) is not standard that i can think of, but on the Host tab everything is workin fine, so it has clearly to do with the service view.
as I’am not having the problem on 2.7.4 (I see some delay, but its not unusable as it is on 2.8.x) i’am not sure if its the same problem, but the Symtoms are the same as far as i can see it.
Hi,
Looks like I have the same problem.
550 hosts, 12000+ services.
When I try to display more than 500 services on the same page from the WebUI (IcingaWeb 2.8.2), the browser (Chrome/Opera/Firefox) is loading to 100% CPU usage.
Don’t seem to have the issue on 2.7+.
As Rafael asked, I would liked to know if we can diseable the pi chart for testing ?
Or if there is anything else we can do ?
Disabling the pie charts is only possible by adjusting the code. I’ve attached a patch that does this.
Apply the patch with patch -p3 < no-sparkline-pies.txt at either /usr/share/php/Icinga (package installation) or library/Icinga (git clone) depending on how you’ve installed Icinga Web 2. no-sparkline-pies.txt (868 Bytes)
Once done, any browser you test this with needs to perform a hard refresh. (e.g. Ctrl+F5)
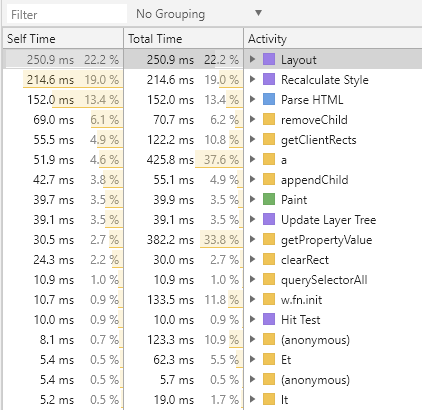
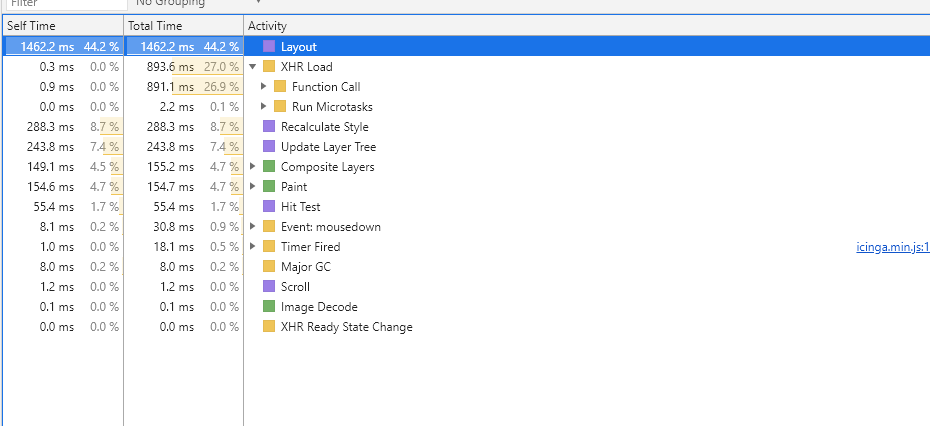
If the issue is not solved, please show again what’s requiring too much time in the call tree.
And, I wouldn’t call this production ready. It’s disabling the pie charts completely. Maybe try the PR I’ve just opened which changes this properly. (Still shows the pie charts, but renders them differently) https://github.com/Icinga/icingaweb2/pull/4235
Well, with this large amount of data to render it will obviously take a bit more time. I think 1.5 seconds are also not that much in this case. It’s also native render time now, and not caused by Javascript anymore.
So I’d see this as fixed then, if the linked PR doesn’t introduce another performance issue.