Please describe your problem as detailed as possible and don’t forget to use a meaningful title
Hi, I have some checkcommands the provide the performance data thresholds using nagios format. That is
:>
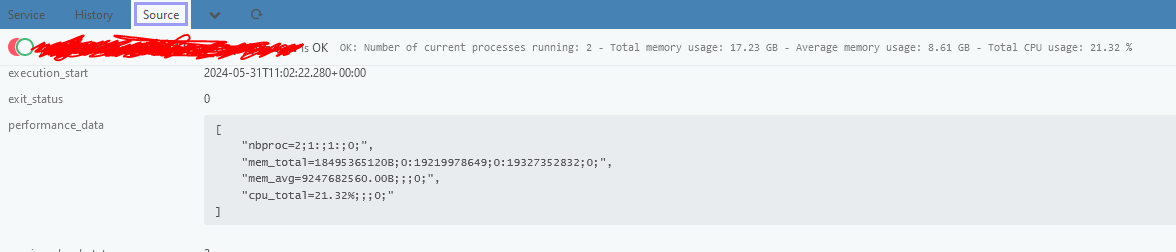
                "output": "OK: Number of current processes running: 2 - Total memory usage: 17.24 GB - Average memory usage: 8.62 GB - Total CPU usage: 32.27 % ",
                "performance_data": [
                    "nbproc=2;1:;1:;0;",
                    "mem_total=18509602816B;0:19219978649;0:19327352832;0;",
                    "mem_avg=9254801408.00B;;;0;",
                    "cpu_total=32.27%;;;0;"
                ],
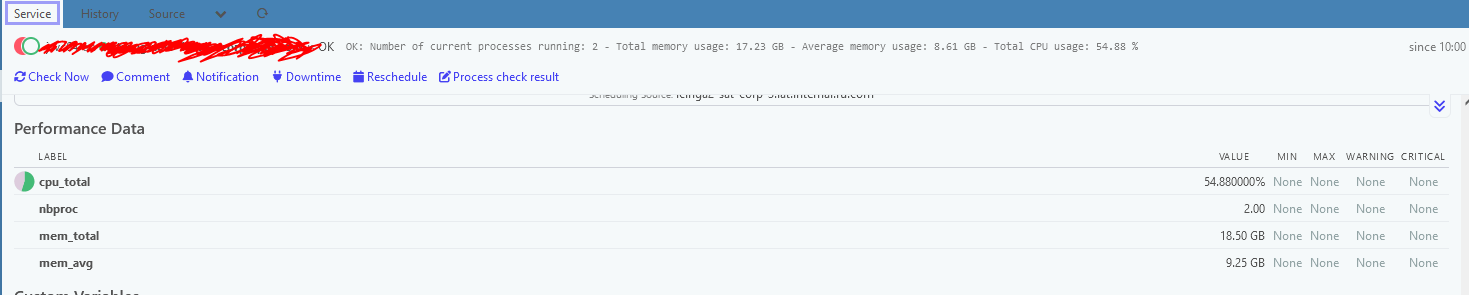
Do you think you can fix the visualization part on the icingaweb-icingadb module ? I understand that influxdb itself might not be able to cope with the nagios range standard (have not checked), but at least the web component should display it.
Operating System and version
root@ix ~# icinga2 --version
icinga2 - The Icinga 2 network monitoring daemon (version: r2.13.6-1)
Copyright (c) 2012-2024 Icinga GmbH (https://icinga.com/)
License GPLv2+: GNU GPL version 2 or later https://gnu.org/licenses/gpl2.html
This is free software: you are free to change and redistribute it.
There is NO WARRANTY, to the extent permitted by law.
System information:
Platform: CentOS Linux
Platform version: 7 (Core)
Kernel: Linux
Kernel version: 3.10.0-1160.114.2.el7.x86_64
Architecture: x86_64
Build information:
Compiler: GNU 11.2.1
Build host: runner-hh8q3bz2-project-575-concurrent-0
OpenSSL version: OpenSSL 1.0.2k-fips 26 Jan 2017
If you run multiple Icinga 2 instances, the zones.conf file (or icinga2 object list --type Endpoint and icinga2 object list --type Zone) from all affected nodes
Not needed.
label can contain any characters except the equals sign or single quote (')
the single quotes for the label are optional. Required if spaces are in the label
label length is arbitrary, but ideally the first 19 characters are unique (due to a limitation in RRD). Be aware of a limitation in the amount of data that NRPE returns to Nagios
to specify a quote character, use two single quotes
warn, crit, min or max may be null (for example, if the threshold is not defined or min and max do not apply). Trailing unfilled semicolons can be dropped
min and max are not required if UOM=%
value, min and max in class [-0-9.]. Must all be the same UOM. value may be a literal “U” instead, this would indicate that the actual value couldn’t be determined
warn and crit are in the range format (see Section 2.5). Must be the same UOM
UOM (unit of measurement) is one of:
no unit specified - assume a number (int or float) of things (eg, users, processes, load averages)
s - seconds (also us, ms)
% - percentage
B - bytes (also KB, MB, TB)
c - a continous counter (such as bytes transmitted on an interface)
It is up to third party programs to convert the Monitoring Plugins performance data into graphs.
Also it just always made sense to me, that if one defines thresholds as ranges via command line arguments to report them back in the perfdata. How else could one try to graph the thresholds without this information?
as for the need to debug the checkcommand, there’s no need for it: used checkcommands do comply with the monitoring standards, as shown on the ‘source’ tab of the icingaweb2 or ton the api result for the last check command. (icinga2 core does recognizes the output and the perf data and the exit_code)
as per specs:
Nagios defined guidelines for plugins where both perf data on output from checkcommands (is fully explanied):
Taking is is a known bug for displaying none instead of the range on icingaweb2 component and leaving as is (too bad I could not find the bug here before raising).
Not sure if influxdb support ranges as ‘warn’/‘critical’ fields (not checked) or how could they be plotted on grafana after registering them as string; But Icinga2 does not pass the range to the backend either. only the normalized value of the outcome (bytes) as per their documentation, an in this case the min 0 value form the outcome.
One could always split the upper and the lower bound of the threshold into separate lines and use config from query results in the Grafana panel to visualize the thresholds.