I have question, maybe someone did played with it. I am planing to install 2nd performance mgmt - influxdb/grafana by side our graphite. Is it ok to use both approach in same time? Will this have high imapact on Icinga2? Ofc 2nd prefromance mgmt will be on seperate machine, but dont know how icinga2 will handle it (We have 2 masters HA setup and around 40 satellites and during the time we will have more satellites). For now I dont think it could be problem but maybe some of you guys have some exp.
Main reason is cause we want to create some custom dashboard and we wanted to use Grafana.
One limitation is the hook for the Performance graph which allows only one solution to hook in as far as I remember. So you would be limited to the Graphite or Grafana Module for integration, not both in parallel. But you can add a menu entry for Grafana or even Host or Service action for at least some integration.
Just out of personal interest why not stick to Graphite as backend and add Grafana as frontend? Or the other way round move everything to InfluxDB and Grafana (and just keep Graphite for historically reasons as long as the data are needed)?
thank you very much for response. This limitation what you said is also ok. Don’t need to have both modules on web interface, it is enough only 1,
lets said for example we will leave graphite module as it is and grafana will be 2nd one which will not be part of icingaweb interface of our masters, it will be part of custom dashboard.
I didnt thought about this on that way. Thank you for really good suggestions. This is good if we wanted to get rid of graphite.
I will think about Graphite as backend and add Grafana as frontend … maybe it will be wining combination … once again thx
We just wanted to separate “active monitoring” process from “active viewing” process and any request for graphs view should be “attack” different performance source.
I have noticed some potential performance issue when some customer used web interface and call some graphs.
We got performance issue with graphite when 3 person of that customer called each of them 50 graphs in the same time … and they were searching another page of 50 graphs … …
so don’t wanted also that viewing process interfere with monitoring process … cause it has same source for viewing and storing performance data…
(we have separate backend graphite process with 8 carbon cache processes and 1 carbon relay. This is python version. Maybe we should replace it with golang version or should reconfigure little bit our graphite.
Graphite is more complex to setup/configure then influxdb. Influxdb has been developed for big data purpose and influxdb writer of icinga2 has been developed in C,
so it should be working pretty much fine from my point of veiw)
*** 2nd thing maybe little bit separate from initial asking for advice:
Also we are planing to install icingaweb interface to all our satellites … but not sure how to design whole thing …
Maybe configure satellite to store performance data also in parallel in influxdb and configure icingaweb interface on satellite to use grafana module and influxdb located on that satellite … even we can create some custom dashboard/s in grafana if customer/s or our different team need spacial graphs for some special analytics …
We can also setup alarming from grafana it self, using some mathematical logic for threshold definition … lot of potential application is there
hope I was clear what we want to achieve and didn’t give you much trouble to understand … hope there is some comments about that
For the performance issues: I typically put graphite-web as web API on the graphite servers or a separate one if it is a bigger environment or even multiples if it is really big, this moves the load away from the Icinga Web 2 installation which I also separate from the core so it will never interfere with critical monitoring and notification processes.
And yes, looking at the C- or go-Implemantion of the tools is worth it. While I like the python ones for availability and simple installation because of packages, it is much more work to scale it manually, but it allows also to do more fine tuning. The others automatically scale which make most people’s life easier.
For the satellites with web interface: It depends on your needs. I typically do so if a satellite represents a separate customer environment so I build it with database, graphing solution and web interface and I do not have to worry about multi-tenancy and permissions on the central system.
While it sounds like a good idea to store performance data only on the central environment and let the satellites access it allows for access on data by URL manipulation if using not Grafana and well designed dashboards, so it makes things more complicated (and most time storage is cheaper then the time to do it right ).
If you are pretty sure an environment will not grow put everything on one system, if not better design it for scalability upfront. It is much easier to scale things when needed then to separate them first.
And a last note about the separate alarming directly by grafana. I would avoid to have different solutions with different formats for notification it makes things harder to debug and acceptance of users is also typically higher if it is less complicated for them.
thank you very much on response this is exactly what I was looking for. Yes, our environment is getting bigger and bigger.
Only have worries for customers which we have satellites in HA setup. Currently we have set up in test env to play with it 2 satellites and they are not behaving as our masters in HA setup - acting as “passive-active” mode, our masters are running in “active-active” mode.
Need to find a way to combine and put it on one web interface to not noticed difference or losing performance data if active satellite is down and 1 who is in passive mode took the job. Maybe in this case is better to install web interface on 3rd machine and configure only 1 DB on this new 3rd machine and then both of this satellites should use 1 DB in that customer enviroment?
Once again thank you very much on your cool answers and really fast reply’s
I would always recommend having an external database as some security mechanism to prevent a split-brain scenario only can work when both ha nodes access the db system via external ip.
But why do you think your satellites behave like “active-passive”? If they do so something is definitely broken. Two systems in ha are always “active-active” in Icinga 2, but the exact behaviour of the features differ. Some like checker are real “active-active”, e.g. for checker this means the nodes calculate a hash over the config and based on cluster members actively schedule services for which the node is responsible. Others are more “active-warm standby” like IDO, which queries the database to find if another one is writing and based on this pause the feature until it’s time to take-over.
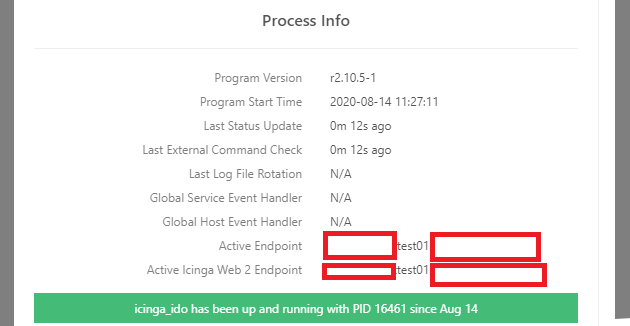
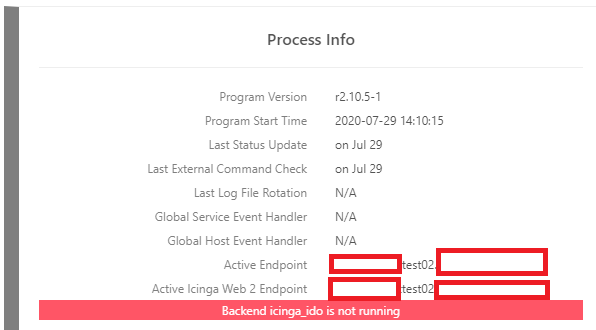
Yes that is my main worries to have “split brain” scenario. This is what were we though in the first place that icinga2 HA setup should always act as “active-active”, but apparently after we did setup it turns out that they are acting as active-passive or our test02 satellite icinga ido is not working. It starts to work on test02 when we stop icinga2 on test01. Maybe we did something wrong, but there is not so big science behind to set it up correctly … anyway I will share some screenshots from our test enviroment
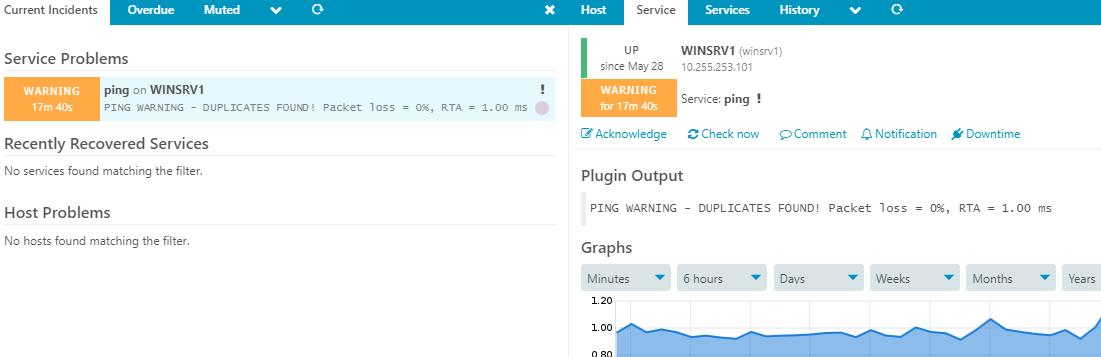
This is from web interface from satellite test02 (last time I have stop icinga2 on test01 at 29th Jul and ping check started to work on test02 satellite)
Setup looks correct, but the errors described still worry me. In case of a fail-over it should switch the backend in about 30s maximum. It seems like it does so (active endpoint), but if it complains about not running it means the data are considered too old. I had environments where such problems were caused by missing/failing time synchronization or you have some problems in your network communication as indicated by the duplicate in the ping check.
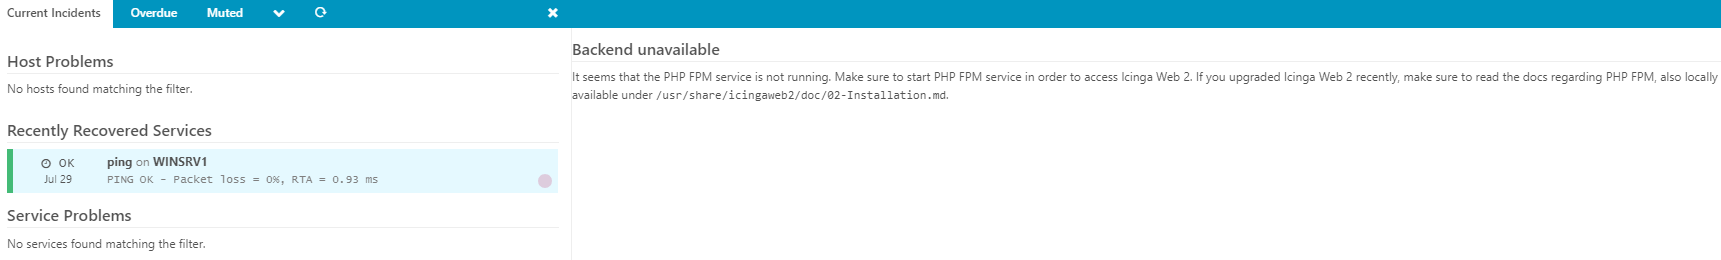
The php fpm error can be caused by a similar network problem by it is unlikely as the default configuration only uses localhost. It is more likely that the configuration of php should be adjusted to have a higher execution time and memory limit.
thank you on respond, dont worry no harm has been done . Actually I did noticed before this error what is related with php-fpm. Cause of this error we are not able to see on proper way web interface on that satellite when it is active. Maybe it is only related with fronted? It is missing frame in Browser where we have output msg from plugin, graphs etc. It is just blank. Maybe we have played to much on that satellite and did something wrong.
I think that the problem could be splited database, cause each satellite has his own db installed on him self. Will try to do sratch:
Maybe this concept is the problem? And that’s why we have not only split brain scenario maybe cause of that have faulty HA fuctionality? I think it should be only 1 DB for both satellites and 1 DB for both masters.
Yes, I really recommend having one shared database instant of two redundant ones in a zone.
If you want to have two separate ones, then you have to disable high availability for the ido feature (enable_ha=false for IdoMysqlConnection or IdoPgsqlConnection).
For others features a look at the same setting is perhaps also worth it, as ha-aware features behaviour different than those without and for historic reasons not all are enable_ha by default.
 …
…