We have single Icinga2 Master & on the same host we have installed graphite… So that we can see every metric on Graphite dashboard in Icinga2 console… I have tried icinga2 dashing & didn’t like that… So we started using the grafana with data source as graphite… so that i have spinned a seperate ec2 instance for grafana… i started working on grafana as datasource graphite… is this is better approach? I am trying to understand the best practice to proceed with all those technologies for dashboard combo… Can you please help me on this?
Hi,
i think there is no best practice. You are already on the right way - test the available programs and use the one which fits you the most.
Is there a reason why you don’t like the dashing?
I’m using here InfluxDB with Grafana for my graphs and dashboards.
Greetz
Icinga2 dashing just showing the overview & I would like to see host based graphs… Let us support I want to see what of the critical metrics at particular server… all the servers should in dropdown & need to choose the stat of each server… This is missing in Icinga2 dashing…
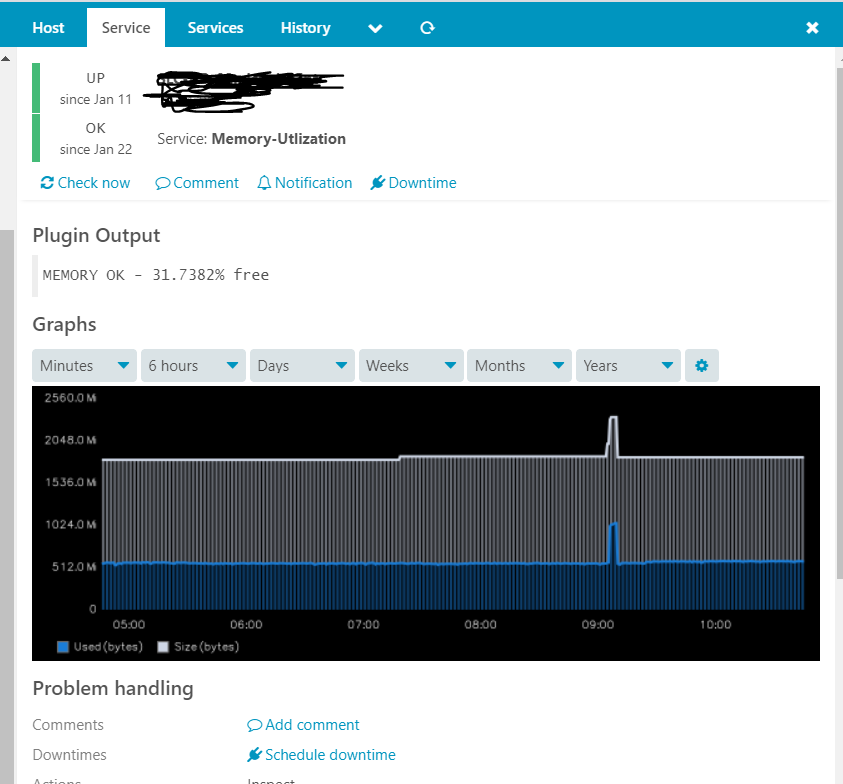
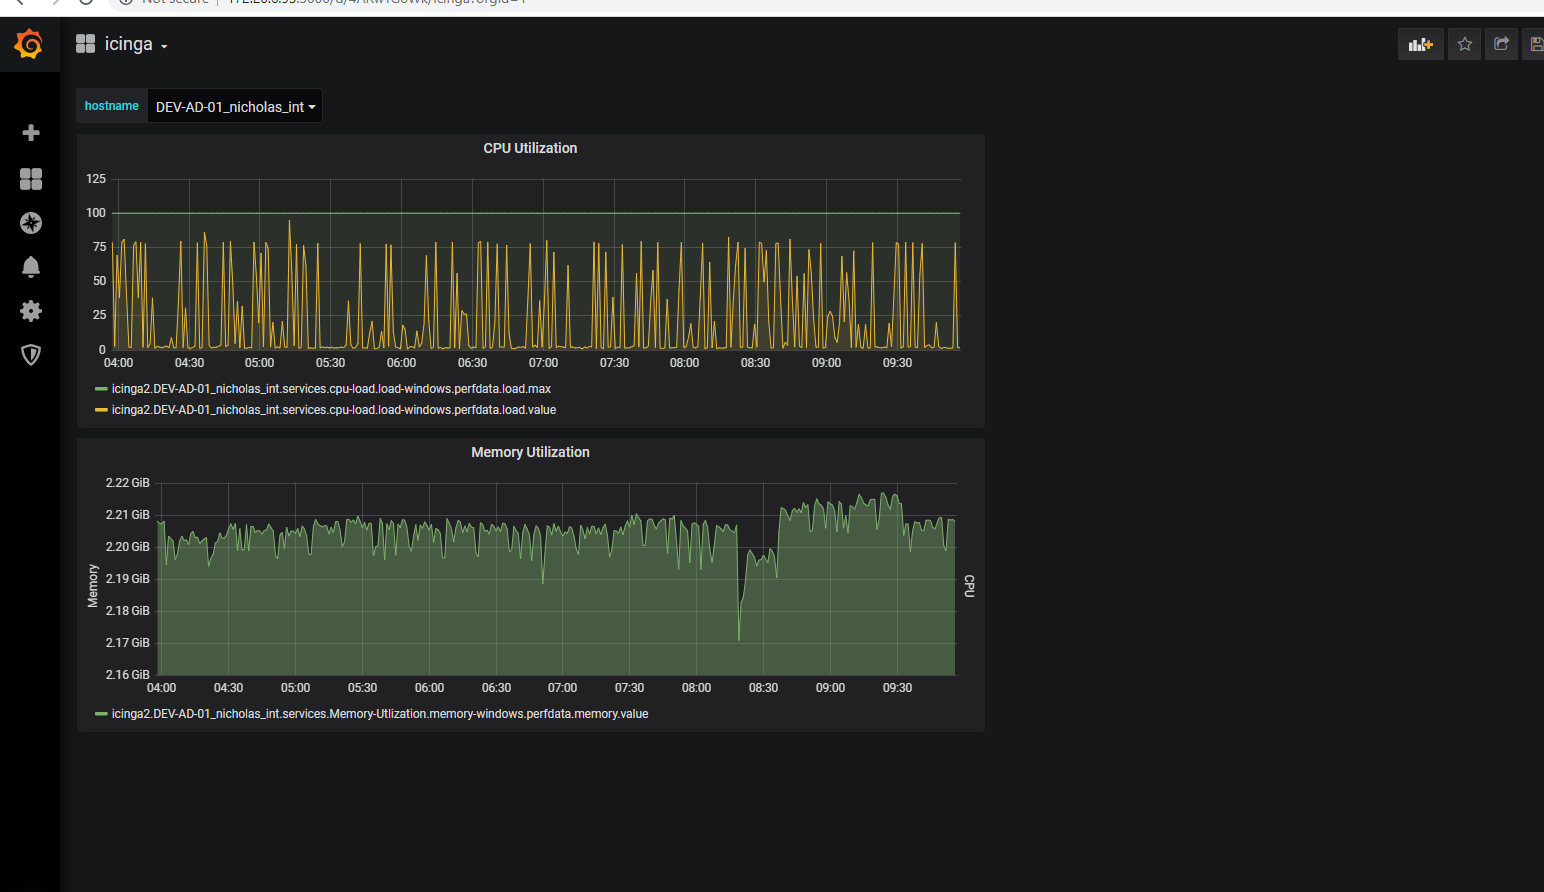
Regarding with Grafana… I am using the graphite with grafana… There is one dashboard with icinga2 with graphite… I have tried with template dashboard 56 from grafana dashboards… 56 is not working at all for me… Then i have been establishing the graphs manually… I have been trying as shown on the dashboard… Is it correct way of doing? can you please advise how build the dashboards…
Hi,
Dashing for Icinga 2 is a fun spare time project of mine, providing a demo for the REST API of Icinga 2. Its purpose never was to become a full blown feature dashboard, but instead show runtime data from one data source and serve as preview to what’s possible. There are multiple other projects on the Internet which incorporate Graph integrations and widgets, and if you feel the need to add this to the Dashing dashboard, you are encouraged to do so.
For a more modern representation, I’d suggest to go for Grafana 6.x where the widgets for the dashboard have greatly been enhanced. With different datasources available, one can correlate metrics from Graphite, InfluxDB, Elasticsearch, even MySQL. If you have Prometheus or Loki as well, this can also fit in there.
In terms of instructions on how to build dashboards, I’d recommend the Grafana docs and their Youtube screencast tutorials. They really help and show it by example, better than any word could describe.
https://www.youtube.com/watch?v=mgcJPREl3CU
Cheers,
Michael
1 Like