Hello Team,
I am installing Grafana and Graphite in icinga2 with influxdb
Base metrics are coming in the Grafana
Graphite and Grafana modules are enabled in icinga2
What is the backend configuration should i apply in the url
performance graph is not showing and connection refused also coming
Thanks in advance
icinga2 --version
icinga2 - The Icinga 2 network monitoring daemon (version: 2.11.2-1)
System information:
Platform: CentOS Linux
Platform version: 7 (Core)
Kernel: Linux
Kernel version: 3.10.0-957.1.3.el7.x86_64
Architecture: x86_64
Hi
sorry i am using influxdb as datasource with grafana
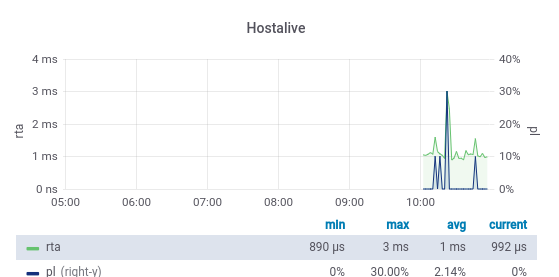
only for host alive graphs are showing how to get performance graph for other services
as well
Sorry i am new to icinga I’m sorry if my questions are a bit wrong.
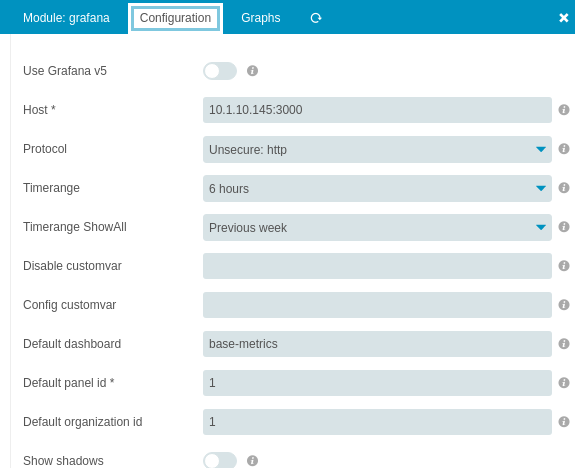
please dont use base-metrics as default dashboard. Use the provides icinga-default from the folder inside the module. Also import the hostalive dashboard from the provided one and configure a graph for the hostalive check (host checks different to services, the default dashbaord will not show them).