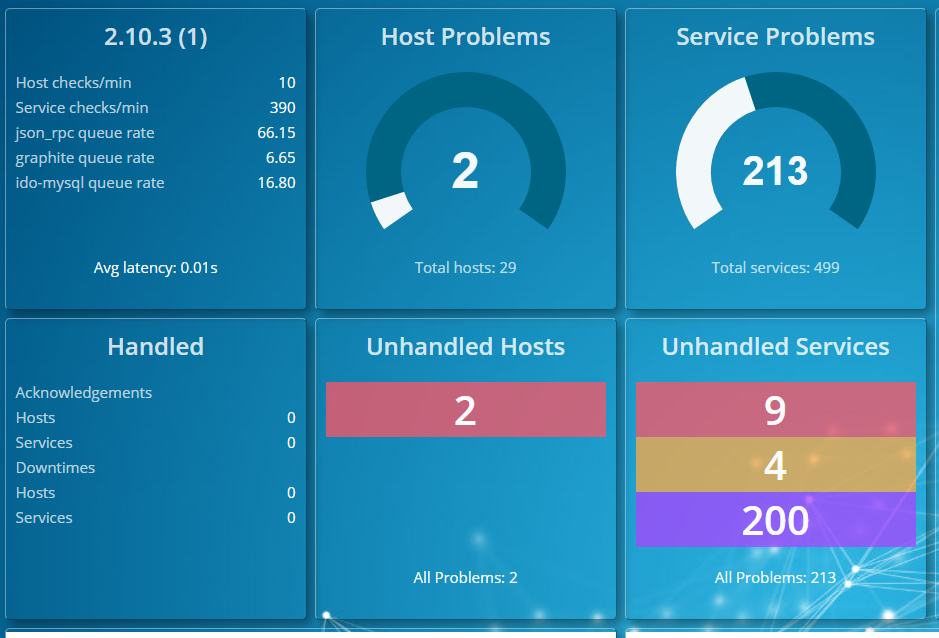
This dashboard is in readable… I want to add more widges & want to add more clear information to my dashboard…
I have tried with grafana as well with Icinga2 with graphite addon… But in grafana i can only see few metrics I am not able see all in dashboard… What would be best possiblity that i can see everything in one dashboard? Can you please advise on this?
I haven’t looked into graph widgets for Dashing yet, but this should be doable with introducing a new widget inside the project (check the development docs). Looking at this overview, I’d start e.g. with this for Graphite.
It may also be a good choice to look into Grafana’s capabilities, plugins and datasource to incorporate Icinga’s data in there. I haven’t done that but there’s a couple of sample widgets around.