-
Icinga Web 2 version: 2.12.0
-
Used modules and their versions:
Loaded Modules
grafana 2.0.3 Configure
icingadb 1.1.0 Configure
incubator 0.20.0 Configure
vspheredb 1.7.1 Configure -
Web browser used: chrome 117.0.5938.132
-
Icinga 2 version used (version: r2.14.0-1)
-
PHP version used (8.0.30)
-
Server operating system and version: Platform: CentOS Linux
Platform version: 7 (Core)
Kernel version: 3.10.0-1160.99.1.el7.x86_64
Hi guys! I’m trying to set up the vspheredb module, but there is almost no documentation about it (or I’m very bad at searching)
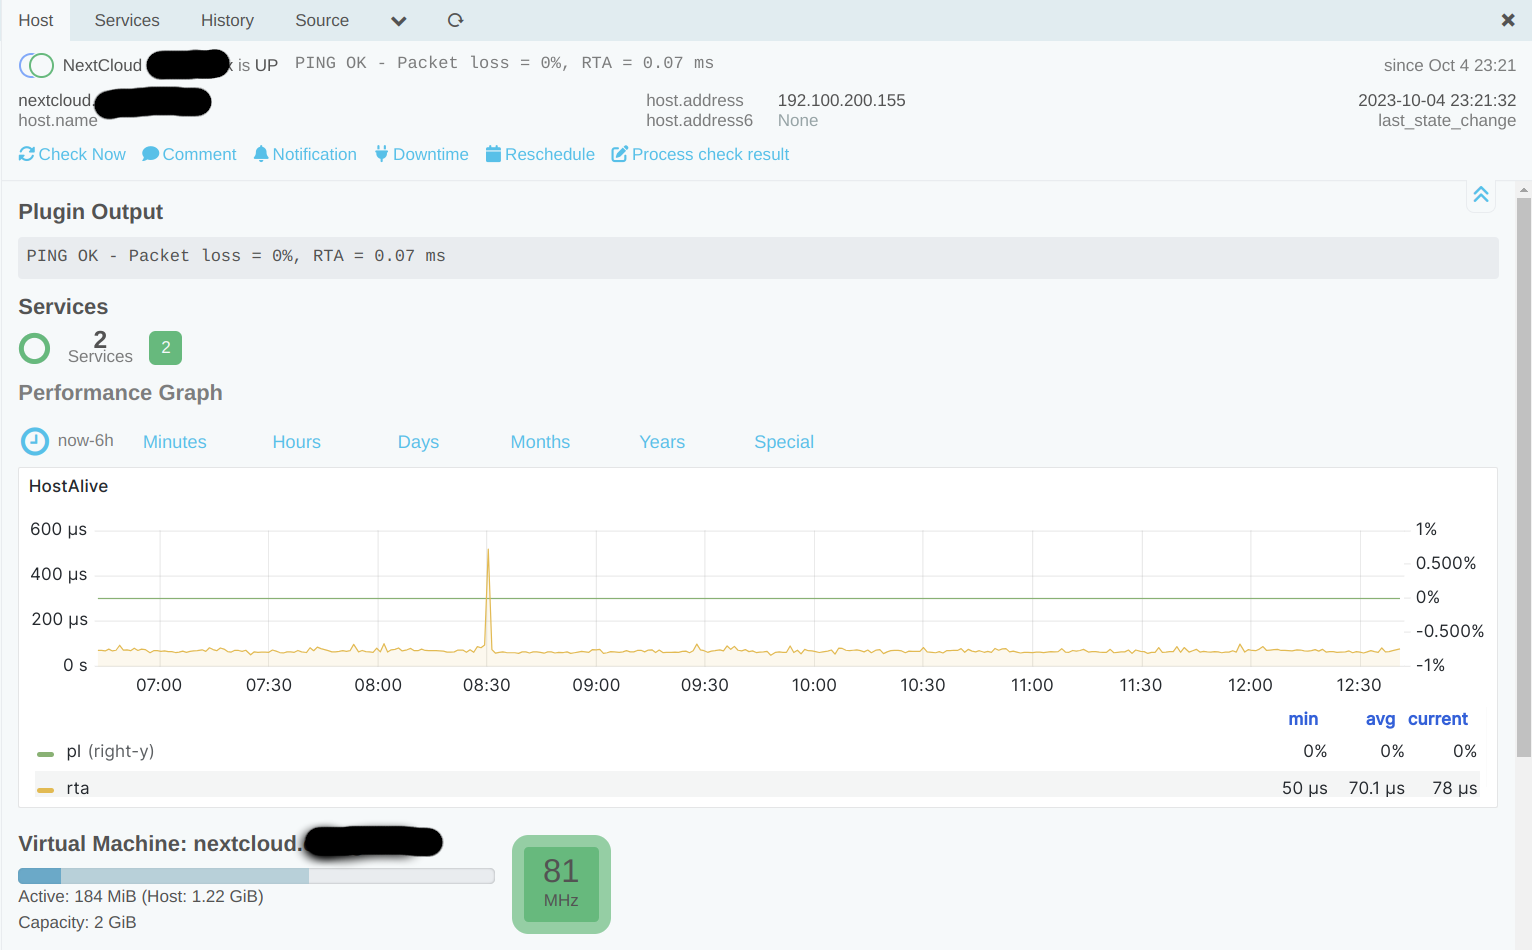
the module is up and running, I can add a vcenter or esx hosts and it can gather all the data , I defined monitoring rules and they also works flawlessly.
Setting up the monitoring integration, as I’m using icingadb, there was no IDO resource, so I activated the monitoring module, created an IDO resource and deactivated the monitoring module again, then I configured the monitoring integration on the vspheredb module and works great! (not very intuitive, but is working now)
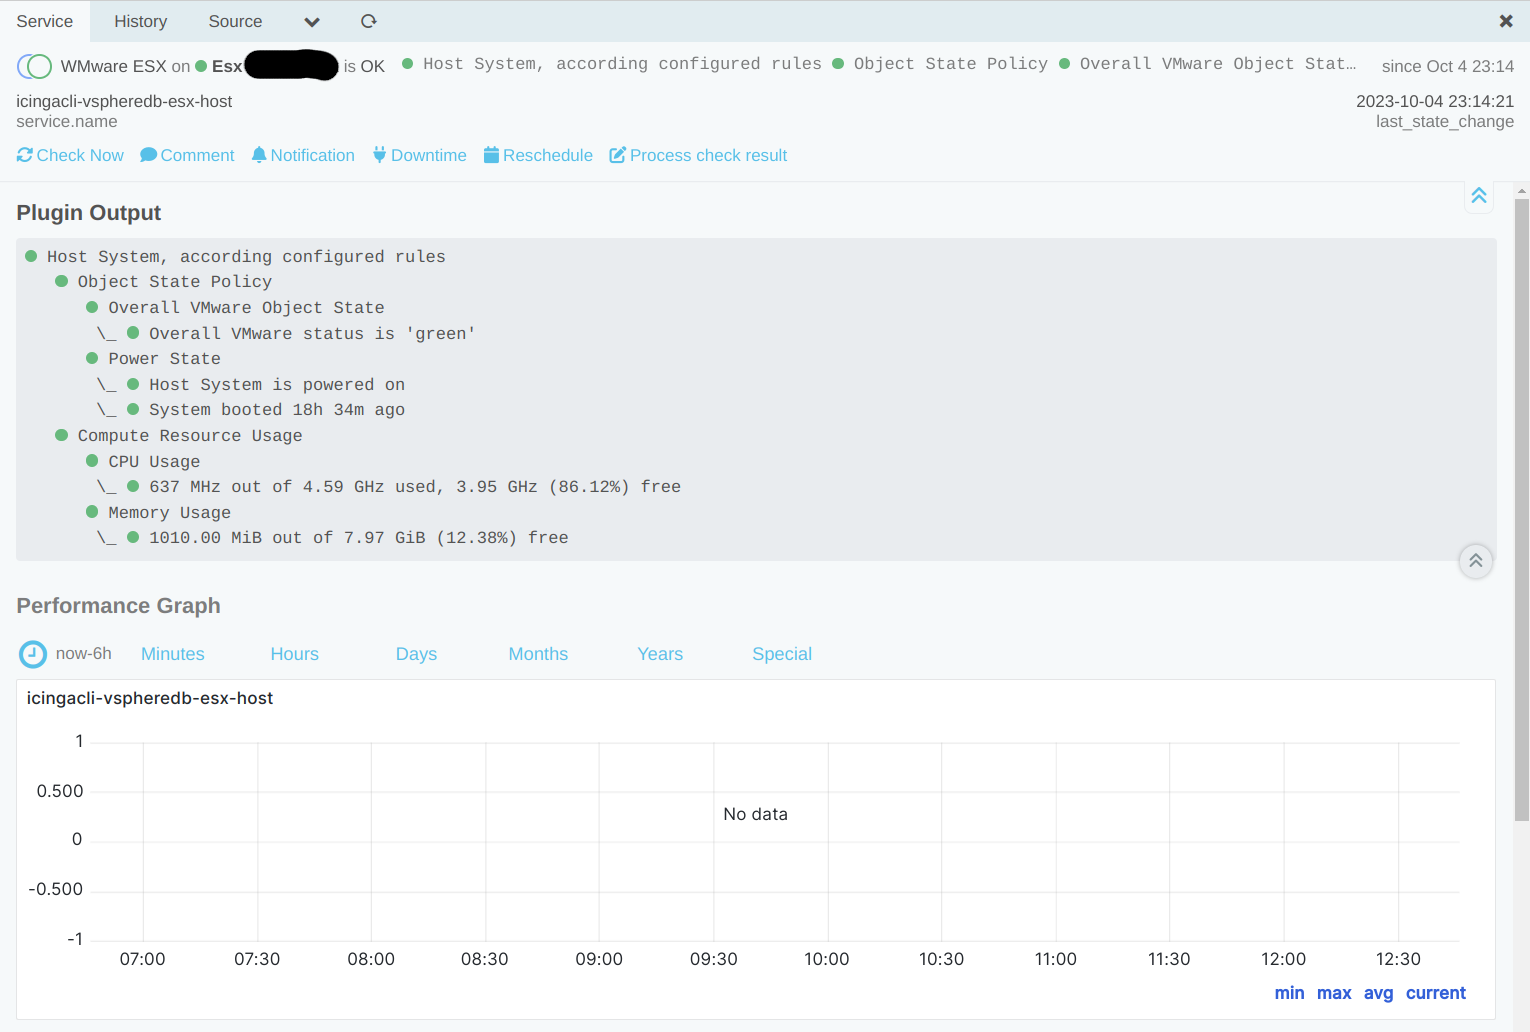
I created the check commands and the services to actively monitor vsphere, esx hosts , vms, datastores, etc. everything works as expected, alarms are getting triggered, data is displayed correctly, but there is no way to get perfdata.
the data is been writed to the influxdb, but without perfdata
my influxdb
>  SELECT * FROM "icingacli-vspheredb";
name: icingacli-vspheredb
time                acknowledgement current_attempt downtime_depth execution_time hostname               latency  max_check_attempts reachable service                                state state_type
----                --------------- --------------- -------------- -------------- --------               -------  ------------------ --------- -------                                ----- ----------
1696468738642856960 0               2               0              0.126118       esx.narf.cl       0.000581 5                  true      icingacli-vspheredb-datastore-storage1 1     0
1696468767046152192 0               3               0              0.092586       esx.narf.cl       0.00066  5                  true      icingacli-vspheredb-datastore-storage1 1     0
1696468795482407936 0               4               0              0.125576       esx.narf.cl       0.000637 5                  true      icingacli-vspheredb-datastore-storage1 1     0
1696468819299655936 0               1               0              0.104623       esx.narf.cl       0.195152 5                  true      icingacli-vspheredb-datastore-storage1 1     1
check output on the linux console
[root@monitor ~]# icingacli vspheredb check datastore --uuid 3796edf8-0796-51ec-8265-7e22d5503044
[OK] Datastore, according configured rules
   [OK] Object State Policy
      [OK] Overall VMware Object State
       \_ [OK] Overall VMware status is 'green'
   [OK] Datastore Health
      [OK] Datastore Usage
       \_ [OK] 7.18 TiB out of 7.28 TiB (98.73%) free
command definition:
object CheckCommand "icingacli-vspheredb" {
    import "plugin-check-command"
    command = [ "/usr/bin/icingacli", "vspheredb", "check" ]
    timeout = 1m
    arguments += {
        "(no key)" = {
            order = 1
            required = true
            skip_key = true
            value = "$vspheredb_check_mode$"
        }
        "--name" = {
            order = 2
            required = false
            value = "$vspheredb_object_name$"
        }
        "--uuid" = {
            order = 2
            required = false
            value = "$vspheredb_object_uuid$"
        }
        "--perfdata" = {
            order = 3
            required = false
            set_if = "$vspheredb_perfdata$"
        }
    }
}
service definition:
apply Service "icingacli-vspheredb-datastore-" for (datastores => config in host.vars.vspheredb_datastore) {
        import "generic-service"
        display_name = "WMware DataStore " + datastores
        check_command = "icingacli-vspheredb"
        vars.vspheredb_check_mode = "datastore"
        vars.vspheredb_perfdata = true
        vars += config
        notes= "Chequeo de datastores vmware" + vars.vspheredb_object_label
        assign where host.vars.vspheredb_datastore
}

apply Service "icingacli-vspheredb-esx-host" {
        import "generic-service"
        display_name = "WMware ESX "
        check_command = "icingacli-vspheredb"
        vars.vspheredb_check_mode = "host"
        vars.vspheredb_perfdata = true
        notes= "Chequeo de host ESX"
        assign where host.vars.vspheredb_esx_host
}

apply Service "icingacli-vspheredb-vm" {
        import "generic-service"
        display_name = "WMware VM "
        check_command = "icingacli-vspheredb"
        vars.vspheredb_check_mode = "vm"
        vars.vspheredb_perfdata = true
        notes= "Chequeo de Virtual Machine"
        assign where host.vars.vspheredb_vm
}
host config file:
object Host "esx.narf.cl" {
        display_name = "Esx OrangeBox"
        import "generic-host"
        enable_flapping = true
        address = "192.100.200.145"
        vars.os = "vmware_esx"
        groups = ["vmware_esx"]

        vars.notification["mail"] = {
        groups = [ "icingaadmins" ]
        }

        #check ping
        vars.check_ping = true

        vars.vspheredb_esx_host = true
        vars.vspheredb_object_name = "$host.name$"

        #VMWare DataStore
        vars.vspheredb_datastore["storage1"] = {
        vspheredb_object_uuid = "3796edf8-0796-51ec-8265-7e22d5503044"
        vspheredb_perfdata = "true"
        }
        #VMWare DataStore
        vars.vspheredb_datastore["cache"] = {
        vspheredb_object_uuid = "ae5d0495-3fa3-599f-a30c-b8f330422c58"
        vspheredb_perfdata = "true"
        }


}
monitoring integration:
esx output (no data to graph)
help output of the icingacli vsphere module (there is no perfdata option)
[root@monitor ~]# icingacli help vspheredb check datastore
Check Datastore Health
======================

USAGE

icingacli vspheredb check datastore [--name <name>|--uuid <uuid>] [--ruleset <set>] [--rule [<ruleset>/]<rule>]
[root@monitoreo ~]# icingacli help vspheredb perf
Deprecated. The main daemon now provides this functionality
===========================================================
where? how? is there is anyway to get perfdata from this module? it’s a wonderful module, works pretty well, but without perfdata is pretty useless to me ![]()