Icinga Not connecting to Zone because it's not in the same zone, a parent or a child zone

Hi.

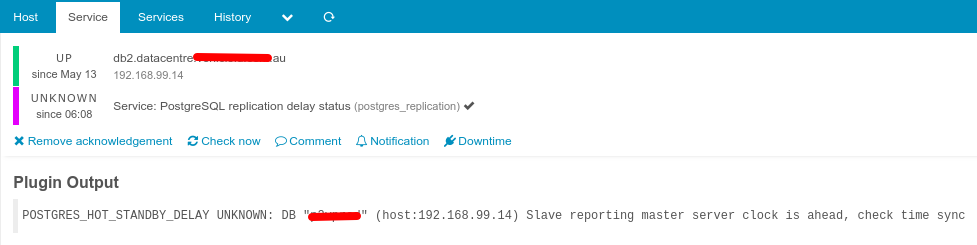
I’ve got 1x master and 1x satellite. A Linux host is reporting service as “unknown” on Icinga Web and I investigated it and I can see the error “Icinga Not connecting to Zone because it’s not in the same zone, a parent or a child zone.” on the debug.log file.

Funny thing is this was working fine until I had to restart Icinga master a couple of days ago.

icinga2 master version = r2.10.3-1
icinga2 satellite version = r2.10.4-1
icinga2 client version = r2.10.2-1

The error only appears for this specific service postgres_replication. Any idea what could I do to fix this? Below you’ll find more information.

host.conf:

// Endpoints & Zones
object Endpoint "db2.datacentre.example.com.au" {
}

object Zone "db2.datacentre.example.com.au" {
     endpoints = [ "db2.datacentre.example.com.au" ]
     parent = "satellite"
}

// Host Objects
object Host "db2.datacentre.example.com.au" {
    import "generic-host"
    check_command = "hostalive"
    address = "192.168.99.14"
    vars.kernel = "centos"
    vars.os = "Linux"
    vars.postgres = true
    vars.postgres_replication = true

host zones.conf:

object Endpoint "icinga2-satellite.datacentre.example.com.au" {
	host = "192.168.99.22"
	port = "5665"
}

object Zone "satellite" {
	endpoints = [ "icinga2-satellite.datacentre.example.com.au" ]
}

object Endpoint "db2.datacentre.example.com.au" {
}

object Zone "db2.datacentre.example.com.au" {
	endpoints = [ "db2.datacentre.example.com.au" ]
	parent = "satellite"
}

object Zone "global-templates" {
	global = true
}

object Zone "director-global" {
	global = true
}

icinga master error log:

[2019-07-12 09:45:25 +1200] debug/ApiListener: Not connecting to Zone 'db2.datacentre.example.com.au' because it's not in the same zone, a parent or a child zone.
[2019-07-12 09:45:32 +1200] debug/Checkable: Update checkable 'db2.datacentre.example.com.au!postgres_replication' with check interval '60' from last check time at 2019-07-12 09:45:32 +1200 (1.56288e+09) to next check time at 2019-07-12 09:46:30 +1200(1.56288e+09).
[2019-07-12 09:45:32 +1200] debug/DbEvents: add checkable check history for 'db2.datacentre.example.com.au!postgres_replication'

services.conf:

// check postgres replication
apply Service "postgres_replication" {
  import "generic-service"
  display_name = "PostgreSQL replication delay status"
  vars.notification_delay = 10m
  check_command = "check_postgres_replication"
  assign where host.vars.postgres == true && host.vars.postgres_replication == true
}

icinga2 object list --type service --name postgres_replication

Object 'db2.datacentre.example.com.au!postgres_replication' of type 'Service':
  % declared in '/etc/icinga2/zones.d/global-templates/services.conf', lines 40:1-40:36
  * __name = "db2.datacentre.example.com.au!postgres_replication"
  * action_url = ""
  * check_command = "check_postgres_replication"
    % = modified in '/etc/icinga2/zones.d/global-templates/services.conf', lines 44:3-44:46
  * check_interval = 60
    % = modified in '/etc/icinga2/zones.d/global-templates/templates.conf', lines 29:3-29:21
  * check_period = ""
  * check_timeout = null
  * command_endpoint = ""
  * display_name = "PostgreSQL replication delay status"
    % = modified in '/etc/icinga2/zones.d/global-templates/services.conf', lines 42:3-42:54
  * enable_active_checks = true
  * enable_event_handler = true
  * enable_flapping = false
  * enable_notifications = true
  * enable_passive_checks = true
  * enable_perfdata = true
  * event_command = ""
  * flapping_threshold = 0
  * flapping_threshold_high = 30
  * flapping_threshold_low = 25
  * groups = [ ]
  * host_name = "db2.datacentre.example.com.au"
    % = modified in '/etc/icinga2/zones.d/global-templates/services.conf', lines 40:1-40:36
  * icon_image = ""
  * icon_image_alt = ""
  * max_check_attempts = 3
    % = modified in '/etc/icinga2/zones.d/global-templates/templates.conf', lines 28:3-28:24
  * name = "postgres_replication"
    % = modified in '/etc/icinga2/zones.d/global-templates/services.conf', lines 40:1-40:36
  * notes = ""
  * notes_url = ""
  * package = "_etc"
    % = modified in '/etc/icinga2/zones.d/global-templates/services.conf', lines 40:1-40:36
  * retry_interval = 30
    % = modified in '/etc/icinga2/zones.d/global-templates/templates.conf', lines 30:3-30:22
  * source_location
    * first_column = 1
    * first_line = 40
    * last_column = 36
    * last_line = 40
    * path = "/etc/icinga2/zones.d/global-templates/services.conf"
  * templates = [ "postgres_replication", "generic-service" ]
    % = modified in '/etc/icinga2/zones.d/global-templates/services.conf', lines 40:1-40:36
    % = modified in '/etc/icinga2/zones.d/global-templates/templates.conf', lines 27:1-27:34
  * type = "Service"
  * vars
    * enable_pagerduty = true
      % = modified in '/etc/icinga2/zones.d/global-templates/templates.conf', lines 32:3-32:30
    * notification_delay = 600
      % = modified in '/etc/icinga2/zones.d/global-templates/services.conf', lines 43:3-43:31
  * volatile = false
  * zone = "satellite"
    % = modified in '/etc/icinga2/zones.d/global-templates/services.conf', lines 40:1-40:36

That’s a debug entry, errors are logged with critical severity. This message is generated for developers e.g. to see whenever a zone tree exists with indirect zones (3 level cluster for example). This instance will only attempt to connect to direct parent, child or same zones.

so… you’re saying there is nothing wrong with Icinga and the reason I see the service as “unknown” is because of the plugin?

The initial topic just says “unknown” without any further details on the output and error itself. So I wanted to clarify on the debug log first. Best would be a screenshot from Icinga Web 2, or a query against the REST API to fetch the runtime state including the full check result output.

Oh, okay!

Here goes…

Screenshot: - The date and time is the same across the master and the slave PG cluster.

REST API [ curl -s -k -u root:icingapassword -X GET -H ‘Accept: application/json’ ‘https://monitor.example.com:5665/v1/objects/services?service=db2.datacentre.example.com.au!postgres_replication ] output:

{

* "results":[
  1. {
    * "attrs":{
      * "__name":"db2.datacentre.example.com.au!postgres_replication",
      * "acknowledgement":1.0,
      * "acknowledgement_expiry":0.0,
      * "action_url":"",
      * "active":true,
      * "check_attempt":1.0,
      * "check_command":"check_postgres_replication",
      * "check_interval":60.0,
      * "check_period":"",
      * "check_timeout":null,
      * "command_endpoint":"",
      * "display_name":"PostgreSQL replication delay status",
      * "downtime_depth":0.0,
      * "enable_active_checks":true,
      * "enable_event_handler":true,
      * "enable_flapping":false,
      * "enable_notifications":true,
      * "enable_passive_checks":true,
      * "enable_perfdata":true,
      * "event_command":"",
      * "flapping":false,
      * "flapping_current":0.0,
      * "flapping_last_change":0.0,
      * "flapping_threshold":0.0,
      * "flapping_threshold_high":30.0,
      * "flapping_threshold_low":25.0,
      * "force_next_check":false,
      * "force_next_notification":false,
      * "groups":[
        1. "pg"],
      * "ha_mode":0.0,
      * "host_name":"db2.datacentre.example.com.au",
      * "icon_image":"",
      * "icon_image_alt":"",
      * "last_check":1562923949.7612769604,
      * "last_check_result":{
        * "active":true,
        * "check_source":"icinga2-satellite.datacentre.example.com.au",
        * "command":[
          1. "/usr/lib64/nagios/plugins/check_postgres_hot_standby_delay",
          2. "--host",
          3. "192.168.99.11,192.168.99.14",
          4. "--dbname",
          5. "pgsqldbtest1",
          6. "--dbuser",
          7. "monitoring",
          8. "--dbpass",
          9. "dbpassword",
          10. "--critical",
          11. "16777216 and 10 min",
          12. "--warning",
          13. "1048576 and 2 min"],
        * "execution_end":1562923949.7611811161,
        * "execution_start":1562923949.5280179977,
        * "exit_status":3.0,
        * "output":"POSTGRES_HOT_STANDBY_DELAY UNKNOWN: DB \"pgsqldbtest1\" (host:192.168.99.14) Slave reporting master server clock is ahead, check time sync ",
        * "performance_data":[
          1. "time=0.02s"],
        * "schedule_end":1562923949.7612769604,
        * "schedule_start":1562923949.5276010036,
        * "state":3.0,
        * "ttl":0.0,
        * "type":"CheckResult",
        * "vars_after":{
          * "attempt":1.0,
          * "reachable":true,
          * "state":3.0,
          * "state_type":1.0},
        * "vars_before":{
          * "attempt":1.0,
          * "reachable":true,
          * "state":3.0,
          * "state_type":1.0}},
      * "last_hard_state":3.0,
      * "last_hard_state_change":1562868599.5459311008,
      * "last_reachable":true,
      * "last_state":3.0,
      * "last_state_change":1562868539.5392179489,
      * "last_state_critical":0.0,
      * "last_state_ok":1562868479.5313780308,
      * "last_state_type":1.0,
      * "last_state_unknown":1562923949.8006169796,
      * "last_state_unreachable":0.0,
      * "last_state_warning":0.0,
      * "max_check_attempts":3.0,
      * "name":"postgres_replication",
      * "next_check":1562924008.410640955,
      * "notes":"",
      * "notes_url":"",
      * "original_attributes":null,
      * "package":"_etc",
      * "paused":false,
      * "retry_interval":30.0,
      * "severity":66.0,
      * "source_location":{
        * "first_column":1.0,
        * "first_line":40.0,
        * "last_column":36.0,
        * "last_line":40.0,
        * "path":"/etc/icinga2/zones.d/global-templates/services.conf"},
      * "state":3.0,
      * "state_type":1.0,
      * "templates":[
        1. "postgres_replication",
        2. "generic-service"],
      * "type":"Service",
      * "vars":{
        * "enable_pagerduty":true,
        * "notification_delay":600.0},
      * "version":0.0,
      * "volatile":false,
      * "zone":"satellite"},
    * "joins":{},
    * "meta":{},
    * "name":"db2.datacentre.example.com.au!postgres_replication",
    * "type":"Service"}]

}

Yep, that’s generated from the plugin. And the error is for real, the pgsql server clocks are not in sync, you’ll need to either fix that yourself or tell your responsible admins to fix that.

1 Like

The pgsql server clocks are identical… but anyway, this is something related to the plugin.

Thanks a lot! I could understand more about the REST API and now debugging and troubleshooting will be easier! :slight_smile:

1 Like