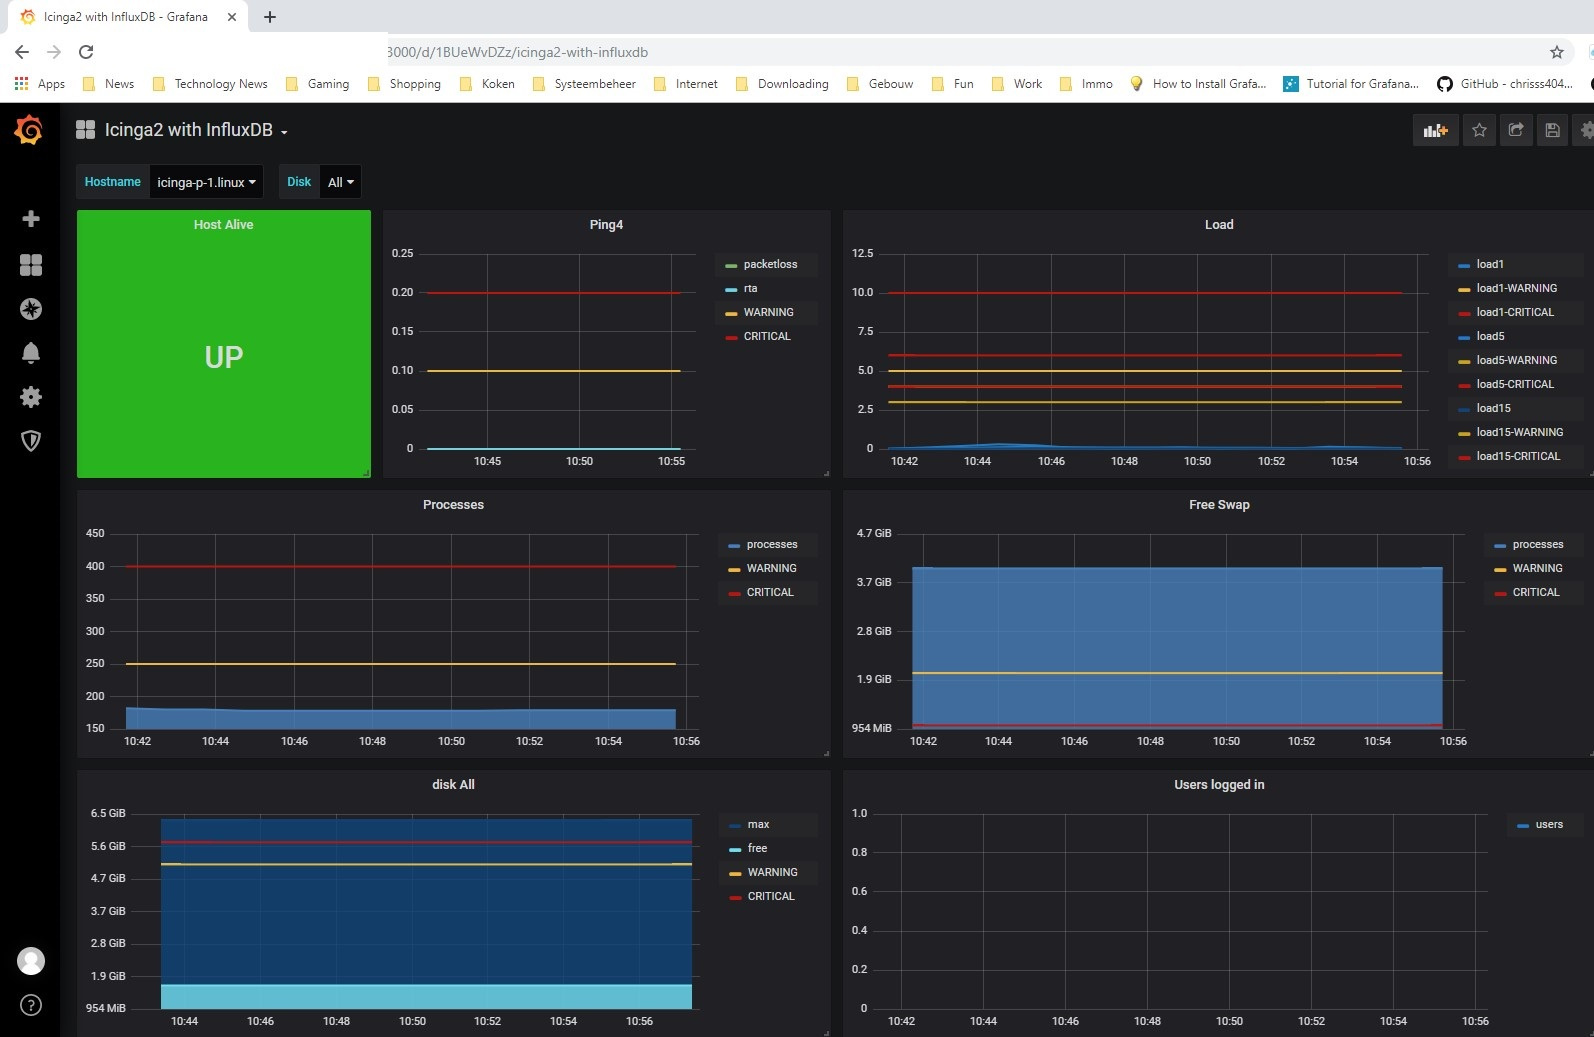
I posted the question after i read the docs. I have the correct graphs for / , /var and /boot in grafana, i just have no clue how to get them in icinga with this module. The variable the dashboard is using is $disk , but i just don’t get what to do next sorry.
Keep in mind that everything here is new for me (icinga, influxdb, grafana). Anyway thanks for the answer.
everyone has a bad day, and just throwing in the docs URL without more hints is not very polite, that’s for sure. Still, it was faster than me working on 2.11
The thing which might be of a problem here is that you’re using a sample dashboard for Icinga from grafana.net.
The InfluxDB module for Icinga Web requires different dashboards to extract the graphs from it. This is described in this step - once that is done, you can proceed with modifying and adding the additional data.
I’m not sure what this means though, but adding a custom variable into a graph would also mean that the underlaying Grafana template needs to understand that - and use that in its search.
You need to use templating, see the docs for influxdb or graphite on howto create dashboards.
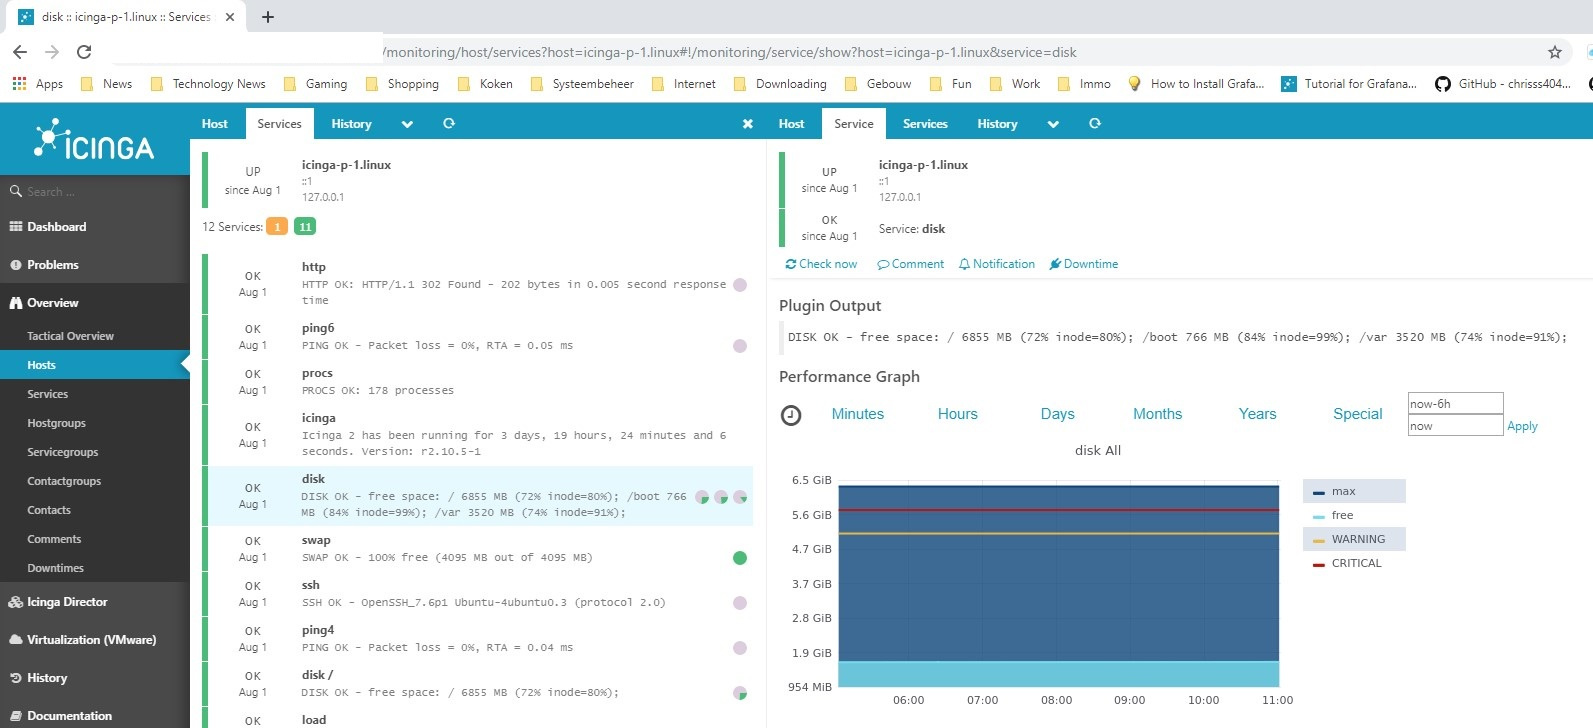
Yet I am not sure if that’s really what you want. Can you post the service objects from your configuration, e.g. the disk services extracted from icinga2 object list --type Service --name *disk* to get a better idea? Also the graphs done thus far, how does the disk graph look like (screenshot)?
Last but not least, please also share the versions involved to allow others to try it out by themselves - Grafana, web module, Icinga Web 2 versions.
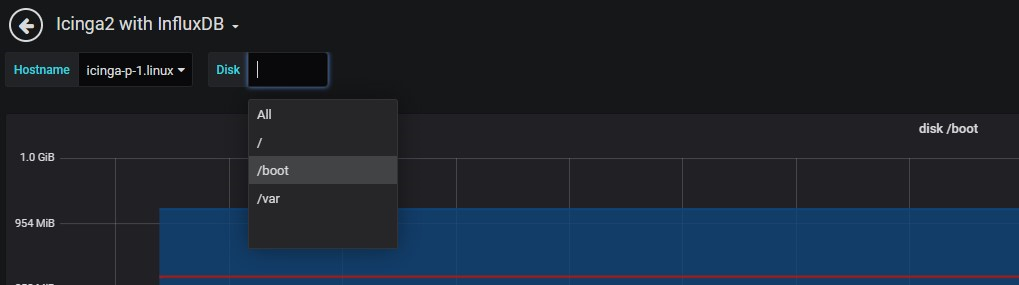
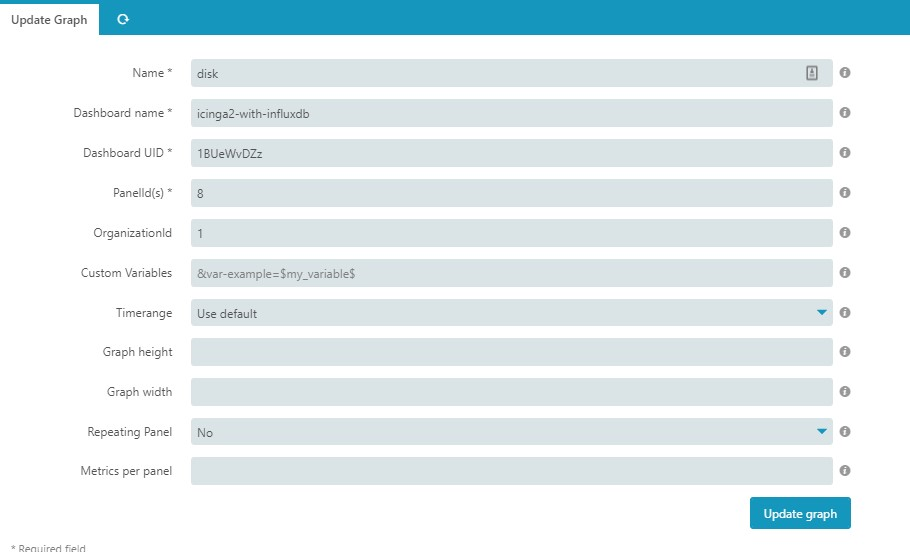
But to also see the graph for /var or /boot i would have to use the custom variables field. If i look at my grafana URL in the screenshot below i’m guessing i would have to use something like &var-disk=/boot but that just doesnt work:
The only solution i see atm. is create my own graphs for / , /var, /boot etc. and NOT use templating, because i can’t get it to work with the custom variables field.
i’m using:
icingaweb2
icinga2 - The Icinga 2 network monitoring daemon (version: r2.10.5-1)
My icinga is completely empty , except for the icingaserver itself atm. (i’m testing if i can actualy use icinga to replace our previous monitoring system, opsview)
Output of icinga2 object list --type Service --name disk:
Object ‘icinga-p-1.linux!disk’ of type ‘Service’:
% declared in ‘/etc/icinga2/conf.d/services.conf’, lines 65:1-65:53
__name = “icinga-p-1.linux!disk”
action_url = “”
check_command = “disk”
% = modified in ‘/etc/icinga2/conf.d/services.conf’, lines 68:3-68:24
check_interval = 60
% = modified in ‘/etc/icinga2/conf.d/templates.conf’, lines 28:3-28:21
check_period = “”
check_timeout = null
command_endpoint = “”
display_name = “disk”
enable_active_checks = true
enable_event_handler = true
enable_flapping = false
enable_notifications = true
enable_passive_checks = true
enable_perfdata = true
event_command = “”
flapping_threshold = 0
flapping_threshold_high = 30
flapping_threshold_low = 25
groups = [ ]
host_name = “icinga-p-1.linux”
% = modified in ‘/etc/icinga2/conf.d/services.conf’, lines 65:1-65:53
icon_image = “”
icon_image_alt = “”
max_check_attempts = 5
% = modified in ‘/etc/icinga2/conf.d/templates.conf’, lines 27:3-27:24
name = “disk”
% = modified in ‘/etc/icinga2/conf.d/services.conf’, lines 65:1-65:53
notes = “”
notes_url = “”
package = “_etc”
% = modified in ‘/etc/icinga2/conf.d/services.conf’, lines 65:1-65:53
retry_interval = 30
% = modified in ‘/etc/icinga2/conf.d/templates.conf’, lines 29:3-29:22
source_location
first_column = 1
first_line = 65
last_column = 53
last_line = 65
path = “/etc/icinga2/conf.d/services.conf”
templates = [ “disk”, “generic-service” ]
% = modified in ‘/etc/icinga2/conf.d/services.conf’, lines 65:1-65:53
% = modified in ‘/etc/icinga2/conf.d/templates.conf’, lines 26:1-26:34
type = “Service”
vars
% = modified in ‘/etc/icinga2/conf.d/services.conf’, lines 70:3-70:16
volatile = false
zone = “”
Object ‘icinga-p-1.linux!disk /’ of type ‘Service’:
% declared in ‘/etc/icinga2/conf.d/services.conf’, lines 65:1-65:53
__name = “icinga-p-1.linux!disk /”
action_url = “”
check_command = “disk”
% = modified in ‘/etc/icinga2/conf.d/services.conf’, lines 68:3-68:24
check_interval = 60
% = modified in ‘/etc/icinga2/conf.d/templates.conf’, lines 28:3-28:21
check_period = “”
check_timeout = null
command_endpoint = “”
display_name = “disk /”
enable_active_checks = true
enable_event_handler = true
enable_flapping = false
enable_notifications = true
enable_passive_checks = true
enable_perfdata = true
event_command = “”
flapping_threshold = 0
flapping_threshold_high = 30
flapping_threshold_low = 25
groups = [ ]
host_name = “icinga-p-1.linux”
% = modified in ‘/etc/icinga2/conf.d/services.conf’, lines 65:1-65:53
icon_image = “”
icon_image_alt = “”
max_check_attempts = 5
% = modified in ‘/etc/icinga2/conf.d/templates.conf’, lines 27:3-27:24
name = “disk /”
% = modified in ‘/etc/icinga2/conf.d/services.conf’, lines 65:1-65:53
notes = “”
notes_url = “”
package = “_etc”
% = modified in ‘/etc/icinga2/conf.d/services.conf’, lines 65:1-65:53
retry_interval = 30
% = modified in ‘/etc/icinga2/conf.d/templates.conf’, lines 29:3-29:22
That’s the first problem. The “Icinga 2 with InfluxDB” is a sample dashboard we (as in the Icinga team) created and uploaded to grafana.net.
The Grafana module is a community module created by @anon66228339 and does not incorporate or know about this dashboard.
Therefore the first step is to import the correct dashboards required by the module. This is is described in this step.
I don’t know whether “our” dashboard works with the Grafana module. In order to stay safe, I would continue with the module’s dashboards and also creating custom one’s based in its logic.
Unfortunately I lack InfluxDB knowledge (don’t like its query language), so I’m not sure if you can build repeating panels with different custom variable values being different disk names.