Icinga Event stream api timeout

I am doing a postman POST call to https://XXXX.XXXX.net:5665/v1/events?queue=america&types=CheckResult and the Status code received is 200OK
But there is no response as it is waiting infinitely. And eventually times out

Icinga version used
icinga2 - The Icinga 2 network monitoring daemon (version: 2.12.1-1)

Feature list
Disabled features: compatlog debuglog elasticsearch gelf graphite icingadb influxdb livestatus opentsdb perfdata statusdata
Enabled features: api checker command ido-mysql mainlog notification syslog

I have a client application in Java which is also throwing socket time out error after sometime while there is no Status error Code.

HI

if I remember correct, in Postman it’s possible to print some code snippset incl. curl. If yes, how does this look? And/or what are your settings in the header. Maybe here is something wrong

To be sure: The configured api user which you put in the menue “Autorization” has enough permissions

Hi,

 [Authorization: Basic cm9vdDppY2luZ2E=, Accept: application/json]

This is the header from my java client app that i have.

in postman it is

And i am not sure about the code snippet you are talking about. Can you explain what that is and how to configure it please ?

I have actually no postman installation. I’ve only used it a few times and it’s been some time ago. As I wrote, if I remember correctly, after you created your api request, there should be button to create a code snippets for some programming languages and also for a curl command. Look here:

I don’t know how actually these docs are.

I think the authorization is your problem. Only two methods are possible if you look into the docs (Icinga2 Api - Icinga 2):

  • API User
  • Certificate
    So from this point it’s not possible to query with token, if I understand your screenshot correctly.

If you decide to use username and password for your api request, you can use this example from the documentation as a guide:

curl -k -s -u root:icinga ‘https://localhost:5665/v1

If you find out which options options in postman match the parameter “-k” and “-s” from the curl command, your request should work.

curl --location --request POST 'https://XXX.net:5665/v1/events?queue=america&types=CheckResult' \
--header 'Content-Type: application/json' \
--header 'Accept: application/json' \
--header 'Authorization: Basic cm9vdDppY2luZ2E=' \
--data-raw ''

this is the code generated from postman

That is what I mean.
If you compare this code with the examples from the docs it’s diffrent. :wink:

your postman should create something like this (if you use username/password):

curl --insecure --silent --user USER[:PASSWORD] –header ‘Content-Type: application/json’
–header ‘Accept: application/json’ --request GET ‘https://XXX.net:5665/v1/events?queue=america&types=CheckResult’

As I wrote above try to find out the options in postman so have the same curl result as the examples from the docs. And also create a certifcate or api user.

Thanks for the clarity.

I ran the below curl command and it works
curl -k --request POST 'https://XXXX.net:5665/v1/events?queue=america&types=CheckResult' --header 'Accept: application/json' --header 'Authorization: Basic cm9vdDppY2luZ2E='

I did the same insecure config in postman which is disabling ssl certificate verification, but still in postman, there is no response for so long.

Still, my main issue is to get it work with the java client as it is a customer ask for me.

My java client times out with this call.

I have a api user root/icinga

in /etc/icinga2/conf.d/api-users.conf

object ApiUser "root" {
  password = "icinga"
  // client_cn = ""

  permissions = [ "*" ]
}

This api user is supposed to have all the permission right ?

and why is it waiting infinitely for the stream if ssl verification is not disabled ?

do you have any idea how do i solve the sockettimeout exception in my java client ?
The same java client was working with Icinga2.6. Our customer had upgraded to icinga 2.11 and since then they face the time out exception. They use basic authentication with root/icinga which has all permissions

You’re welcome.

If the curl call is working, that means the icinga api in your setup is working as well. So maybe there is still something wrong in your postman config. Sadly is like “try and error”. That means which requests is Postman rendering and compare this with the curl which works. Take also a look into the icinga (debug) log. Maybe you find some hints whats going wrong. Maybe here is also a diffrence between recieving the api request from the curl command and from postman.

The parameter -k"/"–insecure" tells curl only, there should no certificate verification. If you would use a certificate instead of username+password, you don’t use this parameter.

About your api user: yes, this one has full permissions.

I’m not a java programmer, so I don’t know what could be wrong there. But if you can fix your issue in the postman config, maybe there in an export for java code. Or other people from the community here have some java code examples for you. In the docs exists some programming examples (https://icinga.com/docs/icinga-2/latest/doc/12-icinga2-api/#programmatic-examples), but sadly not for Java.

BTW: It would be great to format the code here with markdown (https://community.icinga.com/faq#format-markdown). It is more comfortable to read for everybody :wink:

Ok so this is the log that i see in icinga debug log under /var/log/icinga2

This is for a successful curl command. After i do CTRL+C there is the 3rd line which says HTTP client disconnected, which is fine

[2020-12-09 20:35:14 +0530] information/ApiListener: New client connection from [15.122.63.12]:41697 (no client certificate)
[2020-12-09 20:35:14 +0530] information/HttpServerConnection: Request: POST /v1/events?queue=america&types=CheckResult (from [15.122.63.12]:41697), user: root, agent: curl/7.29.0).
[2020-12-09 20:35:35 +0530] information/HttpServerConnection: HTTP client disconnected (from [15.122.63.12]:41697)

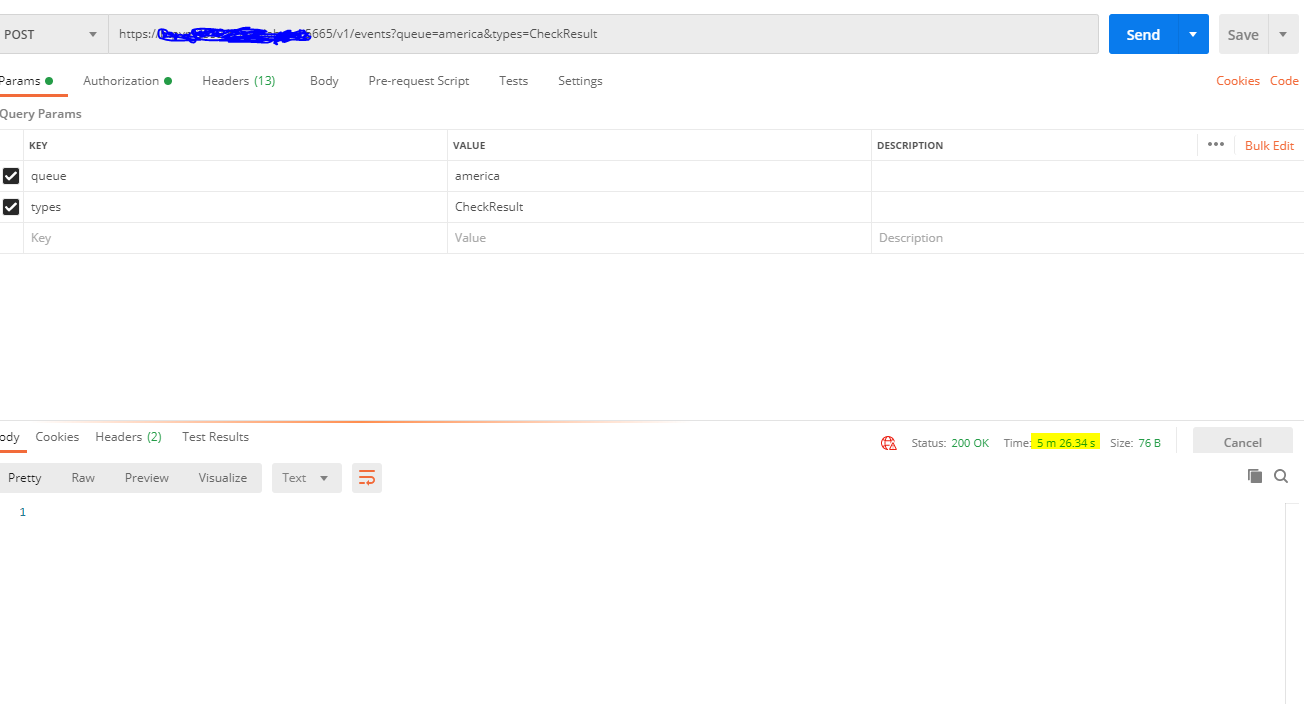
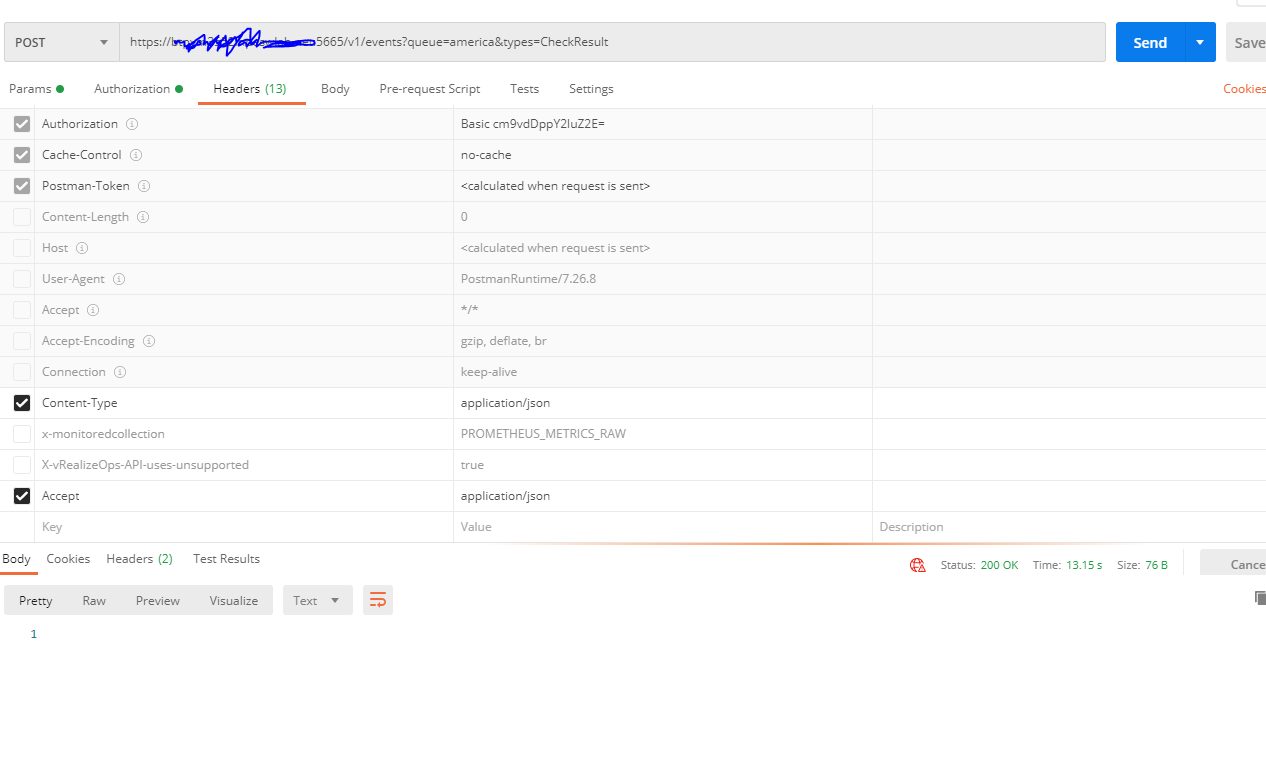
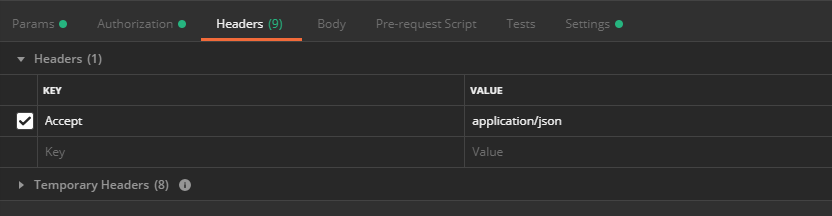
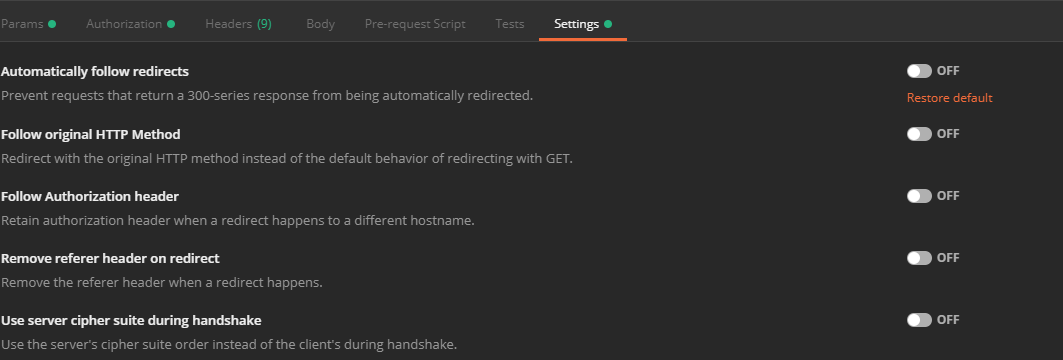
This is the log when i enable the SSL verification in Postman which is equivalent to curl without -k option

[2020-12-09 22:17:19 +0530] information/ApiListener: New client connection from [15.122.78.39]:56708 (no client certificate)
[2020-12-09 22:17:19 +0530] information/ApiListener: No data received on new API connection from [15.122.78.39]:56708. Ensure that the remote endpoints are properly configured in a cluster setup.

The below is the error in the icinga log when i do Curl without -k option

[2020-12-09 20:36:02 +0530] critical/ApiListener: Client TLS handshake failed (from [15.122.63.12]:43015): tlsv1 alert unknown ca

This is the icinga log for the connection from java client

[2020-12-09 20:47:00 +0530] information/ApiListener: New client connection from [15.114.90.247]:58202 (no client certificate)
[2020-12-09 20:47:01 +0530] information/HttpServerConnection: Request: POST /v1/events?queue=opscx&types=StateChange (from [15.114.90.247]:58202), user: root, agent: Apache-HttpClient/4.5.3 (Java/1.8.0_172)).

There is no TLS or SSL certificate error. But still there is no response in the stream and the application times out. Similar to what happens with postman.

There error with client cert verification seems to be different because it says handshake failed clearly.

This is very much confusing. Without any error in the Icinga side, why is it not able to send any data to the stream to java client and postman ?
There should ideally be a Handshake error or certificate error that should be thrown from the icinga api server but strangely it just accepts the request but does not send a data to the stream. This looks like an issue from the icinga side, doesn’t it ?

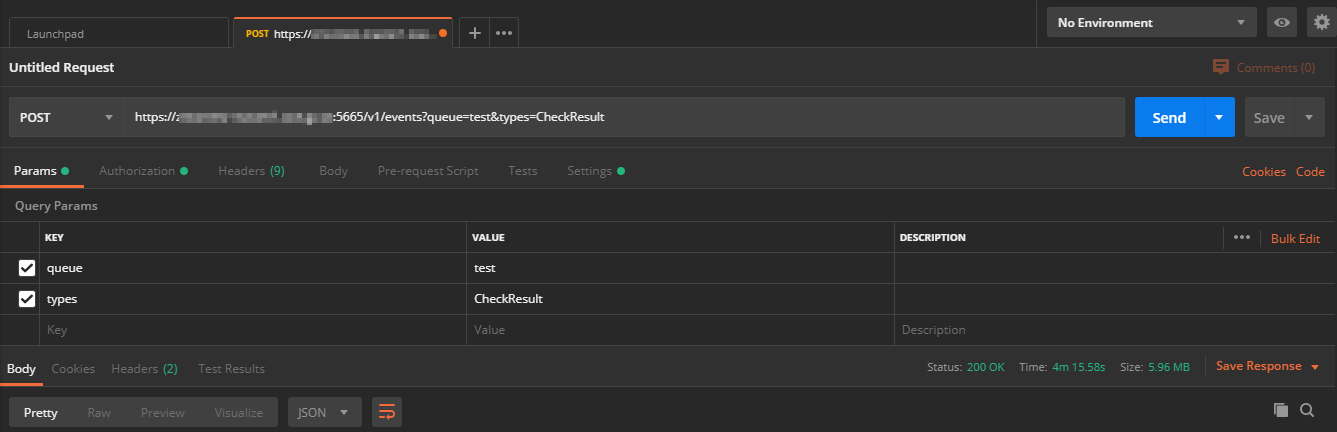
So when i don’t use -k option in the curl, it does not hang or timeout. It gives a reasonable error related to certificate. And with Postman, if i enable SSL verification, there is an error, but icinga shows a different log unlike for Curl, as seen above. And in postman, if i disable SSL verification, i receive 200OK from the server, but the response hangs, there is no data. When server is sending 200OK, then it must be sending data too, isn’t it ?

And with the same Postman and same Java client, i get the data for another api call

https://XXXX.net:5665/v1/objects/hosts?attrs=name

I get 200OK and the data immediately. In the java client as well. It is only with the event stream i see this problem.

I installed Postman again on my PC and did a small test with our test environment (3450 hosts, 8007 service checks). The request needed ~ 4m with 5.96 MB data.

Here some screenshots from the settings:

Which version of Icinga do you have ?
Do you have any specific configuration in Icinga for the self signed certificate or api user ?
Am i missing some cert related configuration in icinga ?

At our test environment is running 2.12.2-1. We have a standard installation like from the docs. I used the api user for icingaweb2 as you can see in the pics. This is also configured like described.

when i use the icingaweb2 user credentials(has specific permissions), i am getting 404 not found error. in the same place if i use another user, i.e. root/icinga which has permission on “*”, i get 200OK and it waits as usual.

Could you share your api-user.conf file ? i want to take a look how it is configured in your machine

nothing special configured

object ApiUser “icingaweb2” {
password = “______”
permissions = [ “*” ]
}

ok thanks for that. I got to know that Postmain waits until it receives the entire message to close the connection and print. But events api is a post call and returns data in stream, so the stream must be open. Curl prints the data as and when it receives and it keeps receiving the data in stream. Whereas postman waits until entire data will be received, which will never happen as icinga will keep the stream open. This is a limitation with Postman. If i stop the icinga service while postman is waiting for data, then the stream gets closed and post man prints entire data that it had received.

My Java client acts differently though, it is not receiving any data at all in the bufferedstream.

Do you know any more debugging option from icinga side where i can see at realtime at every event data dispatch to the slient’s stream ?
the one at /var/log/icinga2/icinga log shows only highly level log like connected or disconnected.
I want to know about each and every event record that it sends to the connected stream.
If you know any, or can point me to any doc or configuration example to do such debugging, i will be able to proceed understanding this issue with my java client more.
thanks

Nice to find this out. As I wrote above I used postman in the past not very often. So good to know.

If we have to debug an issue, we look into the docs: https://icinga.com/docs/icinga-2/latest/doc/15-troubleshooting/ I don’t know more.
As we don’t use the event stream function I don’t have any idea how to debug this in a good way. But maybe you’ll find some in the repo of icingabeat (https://github.com/Icinga/icingabeat) which is also mentioned in the api docs .

reason seems to be due to the queue name in the api. With a different queue name the api call works from java client. There is no reason why it should not work with the existing queue name though. And however, after 2-3 runs from the java client , the same issue happens with the new queue as well.
This is an intermittent issue now. at some point, icinga server does not write any data to the stream. but only in few runs, it works and receives data in the stream. is there any body who has in-depth knowledge in event stream in icinga ? our customer is almost unable to use the Icinga 2.12 at all now.