M.Lake
January 15, 2022, 8:15pm
1
Good evening everybody,
i have a little problem with my selfwritten check. The check was written in C# and everything works fine except the perfdata.
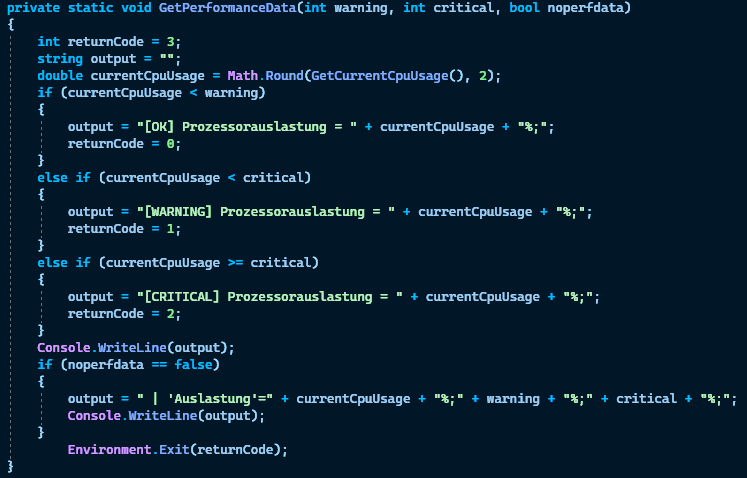
Code-Snippet
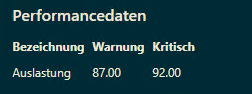
Console output:
leeclemens
January 15, 2022, 10:15pm
2
A few things I noticed:
I don’t think you need the UOM for the thresholds, only the value.
Your value has a comma, which perhaps should be a decimal. Not sure if localization is throwing something off.
Do you have a newline before the pipe?
Possibly unrelated - Were you testing with different arguments when it printed 87 and 92?
M.Lake
January 15, 2022, 10:35pm
3
Thanks for your answer, Lee.
Unfortunately, the UOM was not the cause of the problem.
Yes, that is correct, but to my knowledge this should not be a problem. Would not be the first check that shows me comma values in the PerfData.
No, thats only a space, but it was also not the cause.
I also tested with different arguments, but without success
Please reconsider checking everything because different errors can cause the same symptoms.
Invoke-IcingaCheckCPU -Critical 99.2 -Warning 55.2
[OK] CPU Load
| 'core_4'=43.59794%;55.2;99.2;0;100 'core_total'=39.31161%;55.2;99.2;0;100 'core_6'=43.24592%;55.2;99.2;0;100 'core_5'=27.84643%;55.2;99.2;0;100 'core_7'=30.30363%;55.2;99.2;0;100 'core_0'=36.81477%;55.2;99.2;0;100 'core_2'=46.31499%;55.2;99.2;0;100 'core_1'=40.11831%;55.2;99.2;0;100 'core_3'=46.25629%;55.2;99.2;0;100
0
I just checked the output of Invoke-IcingaCheckCPU i noticed:
decimal is formated with a dot.
there is no % sign for the thresholds.
there are scale values 0;100 to tell icinga the in max
Reason why usage of comma is a bad idea:https://assets.nagios.com/downloads/nagioscore/docs/nagioscore/3/en/perfdata.html
PING ok - Packet loss = 0%, RTA = 0.80 ms | percent_packet_loss=0, rta=0.80
Since icingaweb can also render old nagios checks you comma can break the output
Best regards Nicolas
leeclemens
January 17, 2022, 4:26pm
5
Thanks for the reference regarding the comma! I pointed it out but didn’t have a specific reason.
My understanding is that the scale values can be left off when the UOM is %, since 0-100 is implied/default.
jbrost
January 17, 2022, 4:50pm
6
The unit is supposed to be only given once with with current value. The limits and thresholds are automatically assumed to use the same unit, see also: Service Monitoring - Icinga 2
M.Lake
April 19, 2022, 8:40am
7
Hey, sorry for my late response. I could solve the problem. It was the comma in the output.
Thanks for your help.