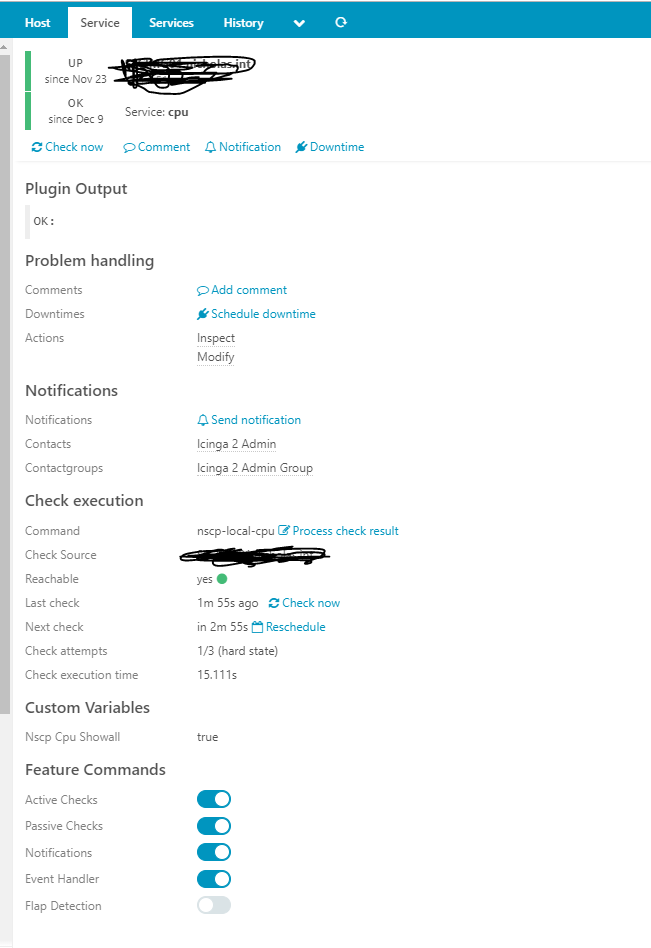
I am trying to get clear information when i look into metric… Like how much cpu currently consuming & what are the values of critical and warning etc… On remote hosts we have installed icinga agent & NSClient++… Can you please advise how can we get the clear information when i see the metic?
CPU will only work when nsclient++ runs as daemon. Better use the windows binary that comes with the icinga agent or give the icinga powershell framework a try.
I have been following this documenation https://icinga.com/2017/07/05/monitoring-windows-clients-with-icinga-2-and-local-nsclient-checks/
Can you please explain clearly? we already deployed Icinga2/NSClient++ agent on all the servers through poweshell module. Any change on remote server side would be difficult at this time…
Any changes that i can do on icinga2 master & its configurations… to gather clear cpu metrics… Here, this is the service apply configuration that i have been using…
apply Service “cpu” {
check_command = “nscp-local-cpu”
command_endpoint = host.vars.client_endpoint
vars.nscp_cpu_showall = true
assign where host.vars.client_endpoint && (host.vars.os == “Windows” || host.vars.os == “AWS-Windows”)
}