Hi,
I have group of devices monitored via sending heartbeats to icinga’s api “process-check-result”.
In this case, icinga stores “state = 0” when the device is online, and 3 (unknown) when it’s down.
So I’m looking for a better way to show this on Grafana
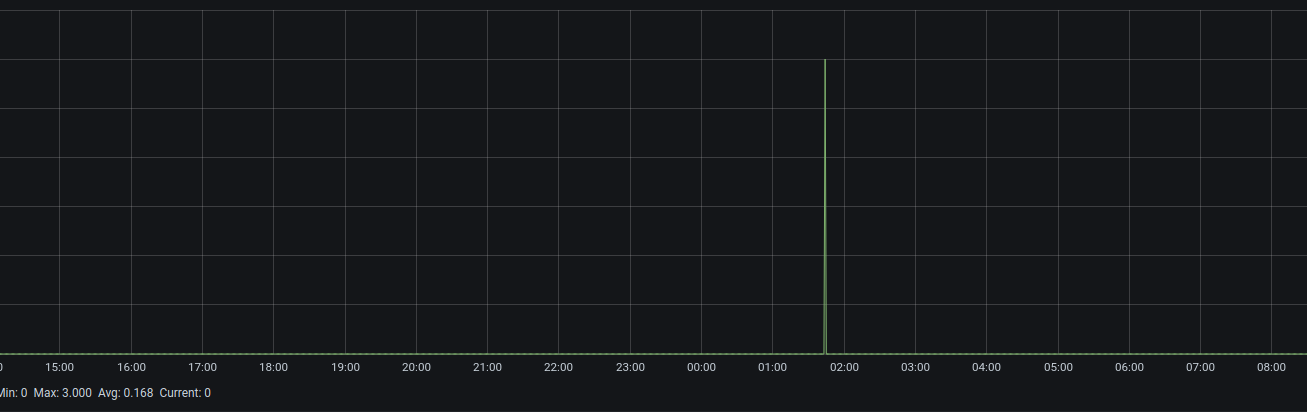
The way it is, now, visually it sounds like oppositive. for example, the graph below represents a device online with a reboot at 1:45 AM:
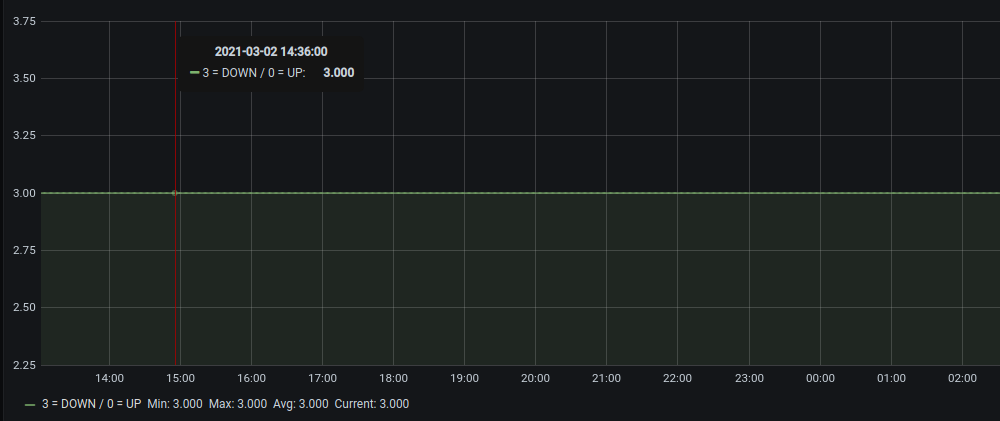
And, the second example represents an offline device - note that, visually, it looks like it’s online:
Is there a way to invert these values, like 1 for online and 0 for offline (only on Grafana)?
Here is the query I’m using:
SELECT min(“state”) FROM “dummy” WHERE (“hostname” =~ /^$hostname$/ AND “service” =~ /^$service$/) AND $timeFilter GROUP BY time($__interval) fill(none)
Any help would be appreciated,
Thanks