Hi, I think I have a misunderstanding in using variables, but I am not able to fix it myself and I only find references for Nagios (wich state that it should work that way). Help is appreciated.
I am using a current Icinga2 with director on RHEL8
What I want to do:
check 2 Service States via check_cluster, return OK, wenn both ok, otherwise warn/critical.
What works:
Running the check with -d “1,1” (or 0,1, 0,0, etc.) gives a valid result, so the basic check is correctly implemented.
What does not work (entered in the corresponding box in director): $$SERVICESTATEID:hostname:servicename$$;$$SERVICESTATEID:hostname:servicename$$
returns always OK, no matter what the service state is (or indeed, if that service is existing at all). The check itself does not seem to handle errors within “-d” as soon as there is a “$” and always returns OK.
Also tried $$service.state_id:hostname:servicename$$;$$service.state_id:hostname:servicename$$
with the same result.
$$service.state_id:hostname:servicename$$;$$service.state_id:hostname:servicename$$ looks very off. Try $host.name$ and $service.name$ so dollar signs around every single variable and double them up in the director to escape them like this $$host.name$$.
hostname & servicename where just my placeholders, no variables. They are manually filled with the right values.
“check_cluster” expects for “-s” a comma separated list of values. The value being 0,1,2,3
I need the service.state_id of service X on host Y but I have no Idea how.
$$SERVICESTATEID:hostname:servicename$$ contained that value (the current state of the service) in Nagios. Obviously it does not contain that value in Icinga, as I used the Nagios way, but how do I get that value correctly?
Icinga has a different approach I understand: Monitoring Basics - Icinga 2).
But I don’t understand how to retrieve that value from any service from any host. (The check collects various states)
I don’t know check_cluster but maybe I did something similar with the Icinga2 DSL.
This checks if all services with the same name on all nodes of a cluster host are OK:
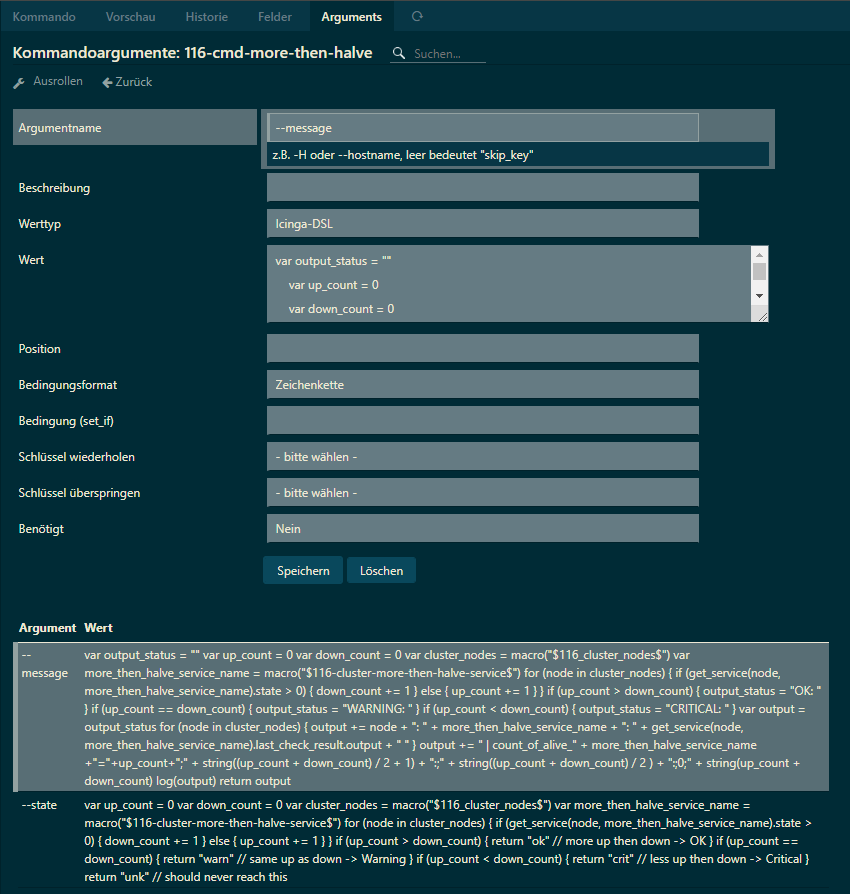
object CheckCommand "116-cmd-more-then-halve" {
import "plugin-check-command"
command = [ "/usr/lib64/nagios/plugins/dummy" ]
timeout = 10s
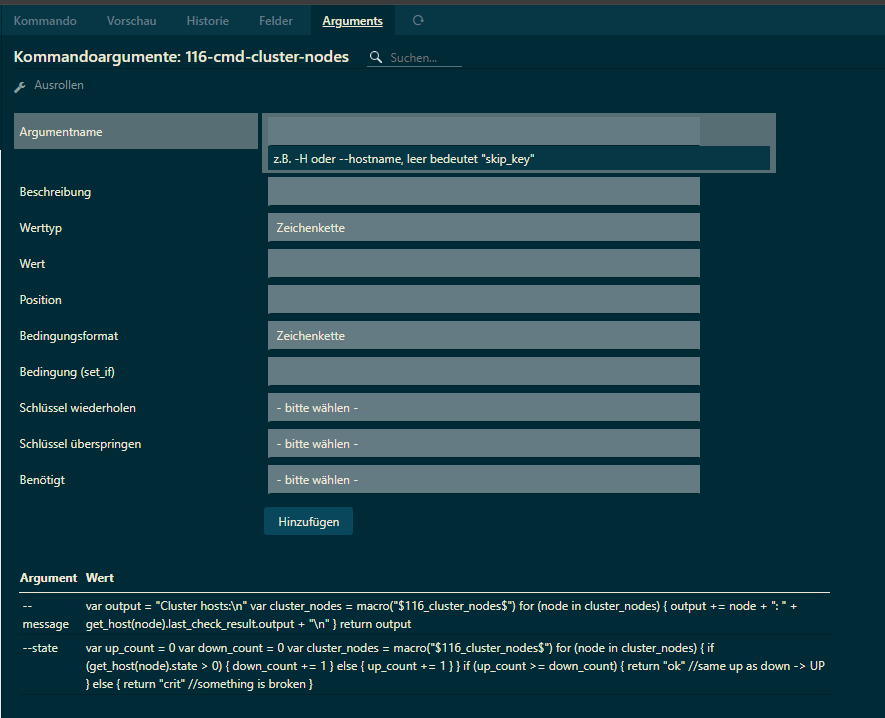
arguments += {
"--message" = {
required = false
value = {{
var output_status = ""
var up_count = 0
var down_count = 0
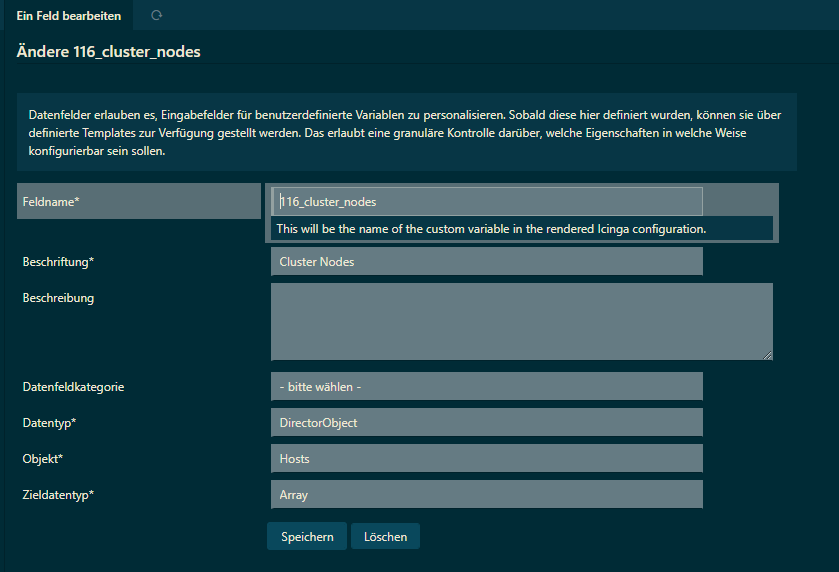
var cluster_nodes = macro("$116_cluster_nodes$")
var more_then_halve_service_name = macro("$116-cluster-more-then-halve-service$")
for (node in cluster_nodes) {
if (get_service(node, more_then_halve_service_name).state > 0) {
down_count += 1
} else {
up_count += 1
}
}
if (up_count > down_count) {
output_status = "OK: "
}
if (up_count == down_count) {
output_status = "WARNING: "
}
if (up_count < down_count) {
output_status = "CRITICAL: "
}
var output = output_status
for (node in cluster_nodes) {
output += node + ": " + more_then_halve_service_name + ": " + get_service(node, more_then_halve_service_name).last_check_result.output + " "
}
output += " | count_of_alive_" + more_then_halve_service_name +"="+up_count+";" + string((up_count + down_count) / 2 + 1) + ":;" + string((up_count + down_count) / 2 ) + ":;0;" + string(up_count + down_count)
log(output)
return output
}}
}
"--state" = {{
/* Icinga 2 does not export DSL function bodies via API */
}}
}
}
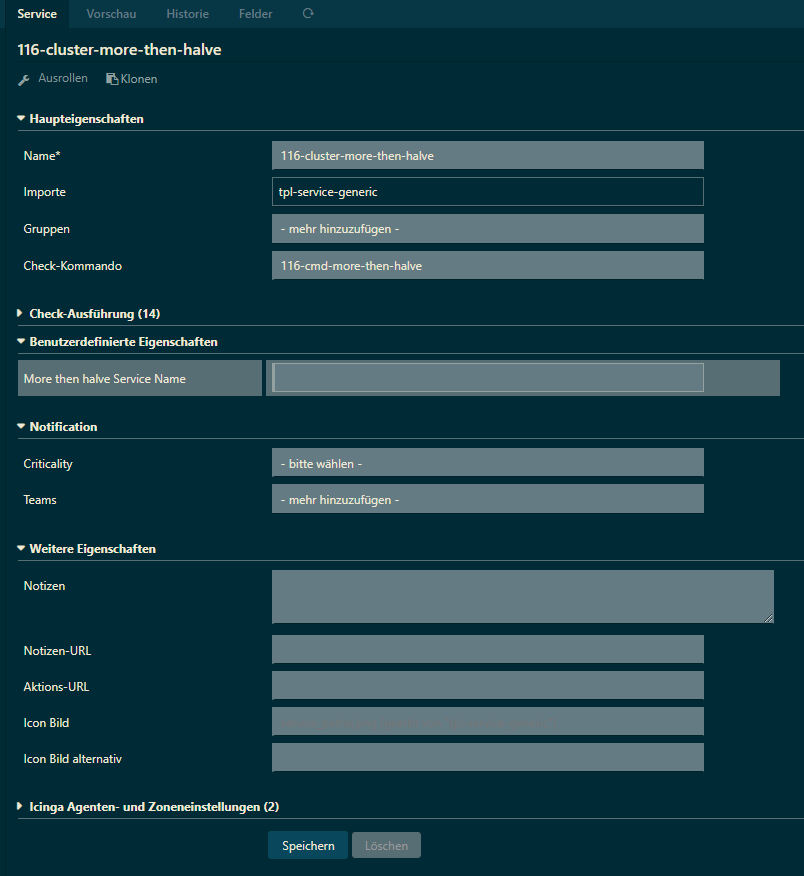
The dummy check comes from the Linuxfabrik’s monitoring-plugins and just reports back, what you send it - it was necessary because of a limitation in the director.
I think this looks basically the same (in a more flexible way than check_cluster) than what I would like to archieve, but the simple approach of check_cluster would suffice for my stuff. I also think its not an issue of the check.
I think if I can answer the rather universal question:
How do I call the variable “service.state_id” from a different host and service?
The check should work perfectly. I changed the header accordingly. My issue is not check_cluster.
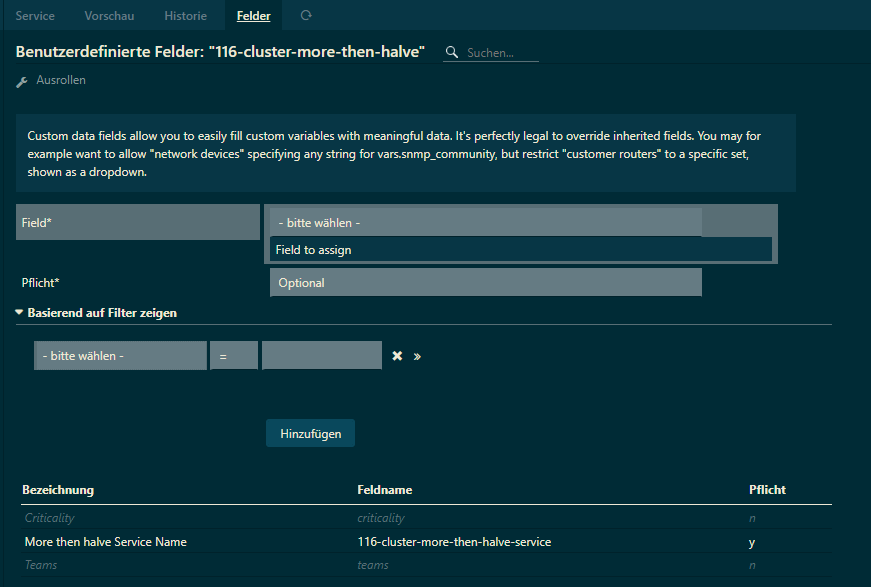
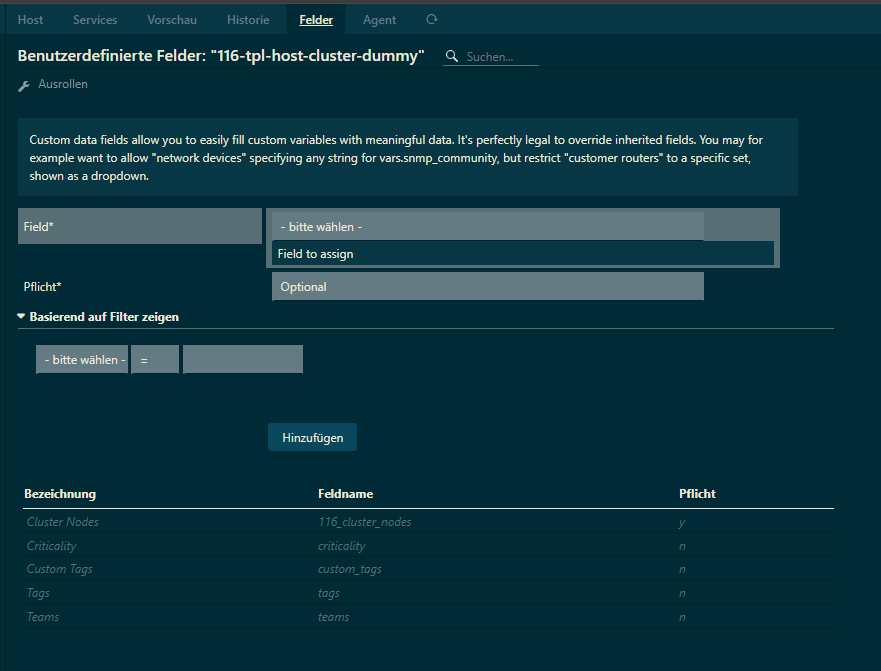
In the director you can only use the DSL in command arguments.
By rearranging the code blocks above you could feed your state_ids into your cluster_check.
If you write the icinga config by hand you’re more flexible and can get any host!service.state_id, in a service, host or command object, to pass it to check_cluster.
Ok, thanks a lot. I’ll have a thorough check on monday…maybe also with your approach.
I was hoping I could simply transfer that check from Nagios to Icinga2
I guess, you could simplify my approach as, I understand, your check does the logic so you would only need to get the state_ids of interesst in a comma separated string in the -s message argument and swap out the dummy check for your check_cluster, spruce it up with some nice variables and fields and it would be quite nicely manageable via the director.
I found a bit more on the topic of the now useless “check_cluster” in the forums by coincidence…I have no Idea why it did not pop up in my search for my issues.
as I am absolutely not familiar with DSL, I need more time for that. Thanks for your input. It helps me a lot to understand that issue better.