Host state differs between Icinga2 API and host_state table in database

Cluster
The cluster this is happening in

  • is 2 ha masters and 2 satellites.
  • The masters use Icingadb, with icingadb-redis, as their backend
  • The data is stored in a 3 node galera cluster
  • There are about 20,000 hosts in the cluster and 55,000 services
  • A small chunk of those hosts update passively and the passive check on update of the checked host state doesn’t match the current Icinga2 api host state

Problem
The data from the api will claim one state and check time and the database contains a different state and check time.

It appears to only be a small percentage (~400 hosts) of all check results that have this problem and we only noticed it because of some of the hosts update their state passively and the passive update is only triggered if the checked state and api state were different.

Here is an example of what we are seeing, the api data is from a Icinga api (5665) request and the db data is from a SQL query.

In this example the api has a result and but the DB is reporting that a check has never been run.

hidden_hostname1: api = 0 @ 2025/02/24 21:04:18 | 2025/02/24 21:04:18; db = 99 @ Invalid timestamp | 1970/01/01 00:00:00
{'api': {'display_name': 'hidden_hostname1', 'last_check': 1740431058.718439, 'last_state': 1, 'last_state_change': 1740431058.718439, 'state': 0}, 'db': {'name': 'hidden_hostname1', 'hard_state': 99, 'soft_state': 99, 'check_attempt': 1, 'last_update': None, 'last_state_change': 0}}

Here is another example showing the db with more recent data than the api

hidden_hostname2: api = 1 @ 2024/12/12 04:52:04 | 2024/12/12 04:52:04; db = 0 @ 2024/12/12 04:57:04 | 2024/12/12 04:57:04
{'api': {'display_name': 'hidden_hostname2', 'last_check': 1733979124.328236, 'last_state': 0, 'last_state_change': 1733979124.328236, 'state': 1}, 'db': {'name': 'hidden_hostname2', 'hard_state': 0, 'soft_state': 0, 'check_attempt': 1, 'last_update': 1733979424496, 'last_state_change': 1733979424496}}

If I look at the times these problems occurred the majority of them occurred at the same point in time suggesting there was a problem affect multiple things.

However there were about half a dozen other conflicting results that were all at different times to each other.

Things I’ve tried
I haven’t been able to find a known issue or find this problem in other clusters we look after (yet, active checking masks the problem with new good check results).

I’ve tried to clear the redis cache and restart redis, icingadb and icinga2 on both headends (one after the other). This allowed the hosts to display the data from the database again (even if that was wrong) which triggered the passive check to post a new check result but new bad results were created after that point.

I’ve checked the cluster for consistency and the sql on all hosts in the cluster and gotten the same result.

At this point I’m not even sure if this is redis, icingadb or the database that is causing the issue though I’m leaning towards redis or icingadb simply because sometimes the API is behind the database.

versions
icinga2 version

icinga2 - The Icinga 2 network monitoring daemon (version: r2.14.3-1)

Copyright (c) 2012-2025 Icinga GmbH (https://icinga.com/)
License GPLv2+: GNU GPL version 2 or later <https://gnu.org/licenses/gpl2.html>
This is free software: you are free to change and redistribute it.
There is NO WARRANTY, to the extent permitted by law.

System information:
  Platform: Debian GNU/Linux
  Platform version: 12 (bookworm)
  Kernel: Linux
  Kernel version: 6.1.0-21-amd64
  Architecture: x86_64

Build information:
  Compiler: GNU 12.2.0
  Build host: runner-hh8q3bz2-project-575-concurrent-0
  OpenSSL version: OpenSSL 3.0.15 3 Sep 2024

Application information:

General paths:
  Config directory: /etc/icinga2
  Data directory: /var/lib/icinga2
  Log directory: /var/log/icinga2
  Cache directory: /var/cache/icinga2
  Spool directory: /var/spool/icinga2
  Run directory: /run/icinga2

Old paths (deprecated):
  Installation root: /usr
  Sysconf directory: /etc
  Run directory (base): /run
  Local state directory: /var

Internal paths:
  Package data directory: /usr/share/icinga2
  State path: /var/lib/icinga2/icinga2.state
  Modified attributes path: /var/lib/icinga2/modified-attributes.conf
  Objects path: /var/cache/icinga2/icinga2.debug
  Vars path: /var/cache/icinga2/icinga2.vars
  PID path: /run/icinga2/icinga2.pid

icingadb version

Icinga DB version: v1.2.0

Build information:
  Go version: go1.22.2 (linux, amd64)
  Git commit: a0a65af0260b9821e4d72692b9c8fda545b6aeca

System information:
  Platform: Debian GNU/Linux
  Platform version: 12 (bookworm)

icingadb-redis version

Redis server v=7.2.6 sha=4e7416a9:0 malloc=jemalloc-5.3.0 bits=64 build=8aaa39c6119e2eaf
This user had a very similar problem:

  • Icinga2 API has has the most current information about the icinga objects.
  • The most recent check-result and last_update are stored in redis
  • If there is a state change, in order to do SLA calculations later, there is an update on the relational mariadb/mysql//postgres database.
  • A restart of Icingadb.service or the icinga2.service will trigger an update on the relational database.

https://icinga.com/docs/icinga-2/latest/doc/14-features/#icinga-db

Icinga DB is a set of components for publishing, synchronizing and visualizing monitoring data in the Icinga ecosystem, consisting of:

  • Icinga 2 with its icingadb feature enabled, responsible for publishing monitoring data to a Redis server, i.e. configuration and its runtime updates, check results, state changes, downtimes, acknowledgements, notifications, and other events such as flapping
  • The Icinga DB daemon, which synchronizes the data between the Redis server and a database
  • And Icinga Web with the Icinga DB Web module enabled, which connects to both Redis and the database to display and work with the most up-to-date data

I don’t quite understand what your trying to say here

Are you saying

a) on state change (hard/soft?) in icinga2 an update to the database is made
b) when icingadb or icinga2 is restarted everything is written to the database
c) both A and B situations are true

I guess like vutuong I’m trying to understand when the…

Icinga DB daemon, which synchronizes the data between the Redis server and a database

…actually does that synchronization because as far as I can tell in some situations the answer is never in both directions


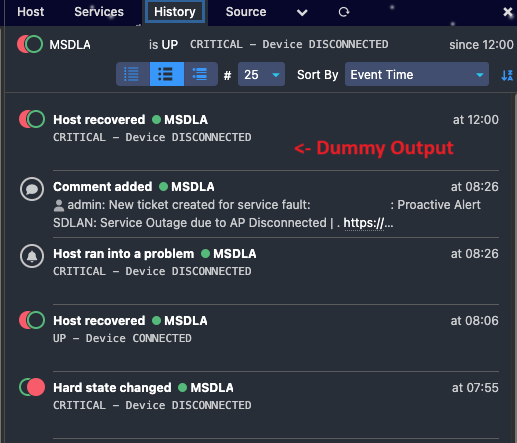
The problem that triggered this investigation was a service went down, then ~5 minutes later it recovered and was up again as seen in the history.

When the api was queried during after the recovery it reported the host was up.

But notifications were sent out 15 minuites after the recovery saying the host was down, again seen in the history.

  • host down - time 0 minuites
  • host up - time 5 minuites
  • notification host is down - time 20 minuites

When we looked in the database hours after the initial problem the host_state didn’t match the api hard_state and the update times differed.

c) both A and B situations are true
but im only sure about hard states → didn’t try for softstates
you can use this query before and after restart the services for testing:

select name, FROM_UNIXTIME(last_update/1000) FROM host left outer join host_state on host.id = host_state.host_id

and yes the data will not match up as long as the most recent data is in redis.

For you notification problem, screenshots of the history would be nice and the notification rules that are applied.

Thanks for clarifying that for me Moreamazingnick, that’s about what I expect in terms of timing and what I see from other clusters I look after, not this one unfortuantly.

Here is the history

This host failed 7:55, recovered 8:06 and then sent notification saying it was failed 8:26.

At 12:00 there is a second recovery but the message say’s CRITICAL, this is because it is a dummy check that normally is updated passively but I ran “Check Now”, the dummy check returned a status of OK but a message that said critical.

Regardless of how the results were posted for the host we still have

  • state DOWN (hard)
  • state UP
  • notification of DOWN
  • state UP (again)

Here is the notification apply rule

apply Notification "nar-sdlan-ap" to Host {
    times.begin = 30m
    command = "cmd_notification_sdlan_ap"
    interval = 0s
    assign where "foo" in host.vars.tags && match("MSDLA*", host.name) 
    states = [ Down, Up ]
    types = [ Custom, Problem, Recovery ]
    users = [ "ticketadmin" ]
}

for reference this is the code I’m using to compare everything

#!/usr/bin/env python3


import argparse  
import json     
from datetime import datetime, timezone 
import requests 
from requests.auth import HTTPBasicAuth  
import urllib3  
import MySQLdb  
import MySQLdb.cursors  

from loguru import logger

# Disable SSL warning messages for insecure HTTPS requests
urllib3.disable_warnings(urllib3.exceptions.InsecureRequestWarning)

def convert_timestamp(timestamp):
    if timestamp is None:
        return "Invalid timestamp"
    
    try:
        # Convert milliseconds to seconds if needed
        if timestamp > 1e10:
            timestamp /= 1000

        # Convert to formatted string using the updated method
        return datetime.fromtimestamp(timestamp, tz=timezone.utc).strftime('%Y/%m/%d %H:%M:%S')
    
    except (ValueError, TypeError):
        return "Invalid timestamp"

def icinga_api(method, endpoint, payload=None, headers=None):
    auth = None
    if args.icinga_url and args.icinga_user and args.icinga_password:
        url = args.icinga_url + endpoint
        auth = HTTPBasicAuth(args.icinga_user, args.icinga_password)
    if not headers:
        headers = {
            'Accept': 'application/json',
            'Content-Type': 'application/json',
            'X-HTTP-Method-Override': 'GET'
        }

    try:
        if method.lower() == 'get':
            response = requests.get(url, headers=headers, auth=auth, data=payload, timeout=30, verify=False)
        elif method.lower() == 'post':
            response = requests.post(url, headers=headers, auth=auth, data=payload, timeout=30, verify=False)
        else:
            logger.error(f"Unsupported method: {method}")
            exit()

        response.raise_for_status()
        return response.json().get('results', [])
    except requests.exceptions.HTTPError as http_err:
        logger.error(f"HTTP error occurred: {http_err}")
        exit()
    except Exception as e:
        logger.error(f"Error occurred: {e}")
        exit()

def get_icingadb_data(_args):
    try:
        conn = MySQLdb.connect(
            host=_args.dbhost,
            port=int(_args.dbport),
            user=_args.dbuser,
            passwd=_args.dbpassword,
            db=_args.dbdatabase,
            cursorclass=MySQLdb.cursors.DictCursor
        )
        cursor = conn.cursor()

        # Get host states
        host_query = """
        SELECT h.name, hs.hard_state, hs.soft_state, check_attempt, last_update, last_state_change
        FROM host h
        JOIN host_state hs ON h.id = hs.host_id
        """
        cursor.execute(host_query)
        host_states = cursor.fetchall()

        cursor.close()
        conn.close()

        return host_states

    except MySQLdb.Error as err:
        logger.error(f"Database error: {err}")
        exit()

# Get Icinga host state
def getIcingaHostObjects():
    icinga_host_data_request_payload = json.dumps({
        "attrs": [ "name", "state", "last_check", "last_state", "last_state_change" ],
    })
    icinga_host_objects = icinga_api("post", "/v1/objects/hosts", payload=icinga_host_data_request_payload)
    return icinga_host_objects


if __name__ == "__main__":
    # Set up command line argument parser
    parser = argparse.ArgumentParser(description="Check Icinga2 and IcingaDB for host and service state mismatches")
    parser.add_argument("--dbhost", required=True, help="Icinga DB host")
    parser.add_argument("--dbport", required=True, help="Icinga DB port")
    parser.add_argument("--dbdatabase", required=True, help="Icinga DB database")
    parser.add_argument("--dbuser", required=True, help="Icinga DB user")
    parser.add_argument("--dbpassword", required=True, help="Icinga DB password")
    parser.add_argument("--icinga_url", required=True, help="Icinga API url")
    parser.add_argument("--icinga_user", required=True, help="Icinga API user")
    parser.add_argument("--icinga_password", required=True, help="Icinga API password")
    args = parser.parse_args()

    # get api data
    icinga_host_objects = getIcingaHostObjects()
    
    # add all host objects to common per host name dataset
    all_hosts = {}
    for obj in icinga_host_objects:
        name = obj.get('attrs', {}).get('name', None)
        if name and name not in all_hosts.keys():
            all_hosts[name] = {'api': obj.get('attrs', {})}
        else: 
            all_hosts[name]['api'] = obj.get('attrs', {})

    # get db data
    icingadb_host_states = get_icingadb_data(args)

    # add all host objects to common per host name dataset
    for obj in icingadb_host_states:
        name = obj.get('name', None)
        if name and name not in all_hosts.keys():
            all_hosts[name] = {'db': obj}
        else: 
            all_hosts[name]['db'] = obj

    # show me the problems
    for host, data in all_hosts.items():
        if 'api' not in data:
            print(f"{host} missing api data")
        elif 'db' not in data:
            print(f"{host} missing db data")
        else:
            # Never been checked (isn't a api vs db problem)
            if data['api']['last_state_change'] == 0 and data['db']['last_state_change'] == 0:
                # print(f"{host} never been checked")   
                continue
            # The api state agree's with the db hard or soft state
            if data['api']['state'] == data['db']['hard_state'] or data['api']['state'] == data['db']['soft_state']:
                continue
            
            # What remains isn't right
            print(f"{host}: api = {data['api']['state']} @ {convert_timestamp(data['api']['last_check'])} | {convert_timestamp(data['api']['last_state_change'])}; db = {data['db']['hard_state']} @ {convert_timestamp(data['db']['last_update'])} | {convert_timestamp(data['db']['last_state_change'])}")
            print(data)

https://icinga.com/docs/icinga-2/latest/doc/03-monitoring-basics/#notification-delay

times.begin = 15m // delay notification window

the times.begin delayed your notification from the problem at 7:55 to 08:26.
but sending it after the host recovered seems a little bit odd.
Maybe this does not work as expected with passive checks.

Do you have Icinga2 as HA or as a single instance?
If it is HA is your environment ID the same on both machines?

and for the comparison between api and mysql, without the data from the redis database this will not align during runtime.

I thought it was incorrect that the notification was sent after the recovery too.
It suggests that some part of Icinga though the host was DOWN when the api and history thought it was UP.

In addition to this the second UP at 12:00 also suggests Icinga thought it was up as my understanding is history records state changes not output changes and there is no output change between the 8:06 UP and 12:00 UP according to the history.


Do you have Icinga2 as HA or as a single instance?

This is a HA cluster, I’ll double check the environment ID.

and for the comparison between api and mysql, without the data from the redis database this will not align during runtime.

While I am not expecting it to align perfectly, I’d expect a health cluster to be align for everything but the most recent updates. This is what I see in other clusters.

If it is HA is your environment ID the same on both machines?

Same environmentID on both masters