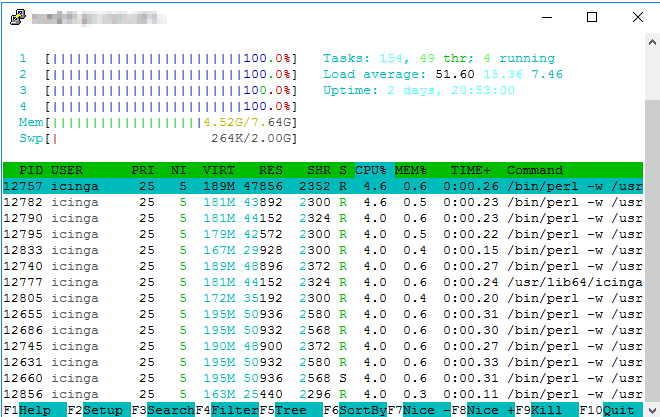
if check_nwc_health is the process that is executed there, then yes. I would guess that after a config redeploy all checks on the satellite are queued to run and he will run as many parallel as possible
typically the cluster config sync, validation and reload takes some resources, but not so many. Depending on the check interval being set, Icinga tries to adjust and run certain checks in between these 5 minutes to prevent a “blind folded” restart. How long do these checks typically run (execution_time) and which check interval is defined for them?
I “suspected” sth. like this. Maybe a dummy question, but “Why?”
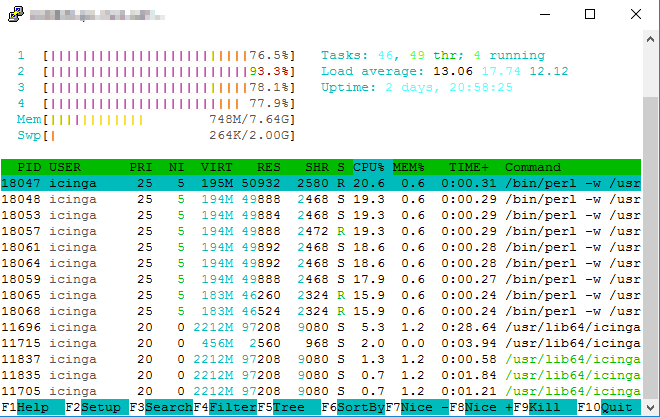
avg_execution_time for the satellites (taken from icinga check) is around 1.2s
Though it is quite spread out with checks running .1s and checks running 4.2s and everything between.
Generally speaking check in an OK state take less than 1s.
I haven’t considered check_execution. The checks the satellites are running are to remote locations (with a sometimes not so fast connection). The check_interval is 5min for all checks run by the satellites.
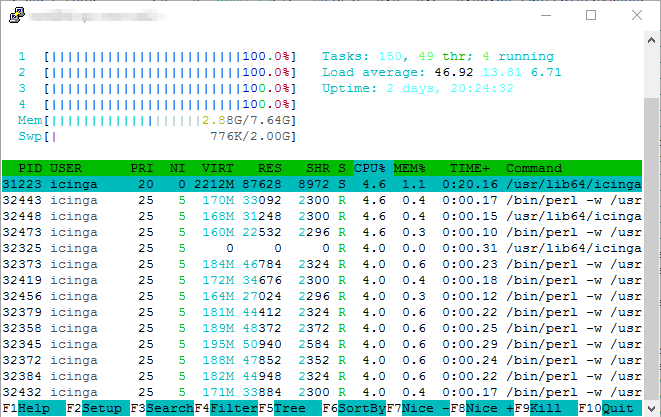
Since you’ve said that the check interval is 5 minutes, this is likely to happen that all of the checks run in this 5 minutes interval with adjusted offsets to avoid many of them in the same second.
I would investigate further and analyse the scheduled_start plus execution_start times from within the last_check_result key in your service objects via the REST API. There may be overlaps, and latency involved - plus slow plugin responses causing a delay for the other pending checks.