Graphite: weird folder name

Hi,

I found graphs showing ‘No Data’ in the WebUI. Then I had a look into the whisper data and found two folder storing same data:

  • lo_BCast_In
  • _‘lo_BCast_In’
    What happend here? Why do I get the second folder?
    The Icinga version is: r2.13.6-1
    In another topic I found the command icinga2 object list --type GraphiteWriter
    This gave me

    But this tells me nothing.
    Does anyone have an idea what happens here? Why is the data doubled? And how can I avoid this?
    Thanks!

Please share the check and it’s output, especially the perfdata string.
And also the directory structure for that service.

If I recall correctly you get a folder for each measurement containing at least a value file (maybe also min, max, warn, crit)
The folder structure can be seen in your output under host_name_template and service_name_template

directory structure to see all folder, which are created by the service ‘python-snmp-interfaces’:

ls -la /var/lib/carbon/whisper/icinga2/'host_name'/services/interfaces/python-snmp-interfaces/perfdata/
total 68
drwxr-xr-x 17 root root 4096 Mar 31 11:36 .
drwxr-xr-x  3 root root 4096 Nov 15 13:13 ..
drwxr-xr-x  2 root root 4096 Nov 15 13:13 eth0_BCast_In
drwxr-xr-x  2 root root 4096 Nov 15 13:13 eth0_BCast_Out
drwxr-xr-x  2 root root 4096 Nov 15 13:13 eth0_In
drwxr-xr-x  2 root root 4096 Nov 15 13:13 eth0_Out
drwxr-xr-x  2 root root 4096 Mar 31 11:36 _'lo_BCast_In'
drwxr-xr-x  2 root root 4096 Nov 15 13:13 lo_BCast_In
drwxr-xr-x  2 root root 4096 Nov 15 13:13 lo_BCast_Out
drwxr-xr-x  2 root root 4096 Nov 15 13:13 lo_In
drwxr-xr-x  2 root root 4096 Nov 15 13:13 lo_Out
drwxr-xr-x  2 root root 4096 Nov 15 13:13 tun0_In
drwxr-xr-x  2 root root 4096 Nov 15 13:13 tun0_Out
drwxr-xr-x  2 root root 4096 Nov 15 13:13 wwan0_In
drwxr-xr-x  2 root root 4096 Nov 15 13:13 wwan0_Out
drwxr-xr-x  2 root root 4096 Mar  9 17:52 wwan1_In
drwxr-xr-x  2 root root 4096 Mar  9 17:52 wwan1_Out

content of the 2 corresponding folder lo_BCast_In & _‘lo_BCast_In’:

ls -la /var/lib/carbon/whisper/icinga2/'host_name'/services/interfaces/python-snmp-interfaces/perfdata/lo_BCast_In
drwxr-xr-x  2 root root   4096 Nov 15 13:13 .
drwxr-xr-x 17 root root   4096 Mar 31 11:36 ..
-rw-r--r--  1 root root 679732 Apr 24 08:27 crit.wsp
-rw-r--r--  1 root root 679732 Apr 24 08:27 max.wsp
-rw-r--r--  1 root root 679732 Apr 24 08:27 min.wsp
-rw-r--r--  1 root root 679732 Apr 24 08:27 value.wsp
-rw-r--r--  1 root root 679732 Apr 24 08:27 warn.wsp

ls -la /var/lib/carbon/whisper/icinga2/'host_name'/services/interfaces/python-snmp-interfaces/perfdata/_\'lo_BCast_In\'/
drwxr-xr-x  2 root root   4096 Mar 31 11:36 .
drwxr-xr-x 17 root root   4096 Mar 31 11:36 ..
-rw-r--r--  1 root root 679732 Mar 31 11:36 crit.wsp
-rw-r--r--  1 root root 679732 Mar 31 11:36 max.wsp
-rw-r--r--  1 root root 679732 Mar 31 11:36 min.wsp
-rw-r--r--  1 root root 679732 Mar 31 11:36 value.wsp
-rw-r--r--  1 root root 679732 Mar 31 11:36 warn.wsp

Call and perfdata string for that check, but I do not have the perfdata for March 31., just a result from a current run

// Call
'/opt/braintower/icinga2/checks/snmpInterfaceCheck/snmpInterfaceChecker.py' '-V' '2c' '-C' '***' '--snmp-timeout=60' '--add-bcast-perfdata' '--allow-zero-interfaces' '-c' '99,50,3' 'ip_address' '-w' '98,40,0' 'up'
// Check result with perfdata 
[OK]: Result: 4 Interfaces OK
[OK]: lo In: 0.00 b/s (0.00%) Out: 0.00 b/s (0.00%)
[OK]: eth0 In: 5.09 kb/s (0.00%) Out: 4.92 kb/s (0.00%)
[OK]: wwan0 In: 49.45 b/s Out: 49.45 b/s
[OK]: tun0 In: 0.00 b/s Out: 0.00 b/s | 'lo_In'=0.00Bits/s;9800000.0;9900000.0;0;10000000 'lo_Out'=0.00Bits/s;9800000.0;9900000.0;0;10000000 'eth0_In'=5085.09Bits/s;980000000.0;990000000.0;0;1000000000 'eth0_Out'=4921.45Bits/s;980000000.0;990000000.0;0;1000000000 'wwan0_In'=49.45Bits/s;None;None;0;None 'wwan0_Out'=49.45Bits/s;None;None;0;None 'tun0_In'=0.00Bits/s;None;None;0;None 'tun0_Out'=0.00Bits/s;None;None;0;None 'lo_BCast_In'=0.00%;40;50;0;100 'lo_BCast_Out'=0.00%;40;50;0;100 'eth0_BCast_In'=0.00%;40;50;0;100 'eth0_BCast_Out'=0.00%;40;50;0;100

Ok, so this perfdata label is not in the output anymore.
I guess the check was implemented differently at the end of march compared to now?

I would simply remove the _‘lo_BCast_In’ folder. As the label is not in the perfdata anymore it won’t get any updates anyway.

No, we didn’t change anything for this check.
We had this problem from beginning.
To tell a bit of the history:
When I started work in my company I moved a check from an old php-check to python for some reasons.
The php-check version had this problem as the check in python now.
Each check produces some of these folders and we can not figure out how this happen. The perfdata is right, whenever I run this check. This weird name never appears in the testruns.
We do this check for about 1000 hosts. It would be great, if we could avoid this effect insted of cleaning up afterwards.
We had removed those folders, but they appeared again. And it’s allways the same folder. No other is created.

Have you checked the script, if it adds some special character in some cases?
The _ is most likely a replace special character (like . or a space).
Feel free to share the script to have more eyes looking at it.

Have you tried other scripts like check_nwc_health or check_snmp_interface or check_iftraffic64 if the produce the same “weird” perfdata?

The name for the perfdata is created in one line (python):
interface_name = matching_interfaces[interface][interface_information]['name'].replace('.', '_')
Is it possible, that the snmp sends the wrong name?
In the next step the name is used to build the perfdata for traffic and for broadcast in the following way:

performance_data_traffic.append(formatPerformanceData(interface_name + '_In', interface_log_data_dict['traffic_in_perfdata'], critUsage, warnUsage, 0, speed))
performance_data_broadcast.append(formatPerformanceData(interface_name + '_BCast_In', interface_log_data_dict['broadcast_in_perfdata'], crit_values_dict['broadcast'], warn_values_dict['broadcast'], 0, 100))
//function formatPerformanceData()
def formatPerformanceData(label, value, crit, warn, min_value, max_value):
    performance_string = "'{}'={};{};{};{};{}".format(label, value, warn, crit, min_value, max_value)
    return performance_string

Join of performancedata to final output for Icinga:

//Initialisation
performance_data_traffic_message = ''
performance_data_broadcast_message = ''
//join for each interface to output message
performance_data_traffic_message += ' '.join(performance_data_traffic) + ' '
performance_data_broadcast_message += ' '.join(performance_data_broadcast) + ' '

Last step is joining icinga message and perfdata with:

if final_state < 3 and performance_data_traffic_message:
    check_message += ' | ' + performance_data_traffic_message
    # add broadcast performance data?
     if add_broadcast_performance_data:
        check_message += performance_data_broadcast_message

I had an idea, but I can’t find the point where an extra ‘_’ is joined to the result string coming out of the function formatPerformanceData(). This function gives the perfdata name the enclosing quotes. And the name

_‘lo_BCast_In’

looks like it happens, that the perfdata string “‘lo_BCast_In’=0.00%;40;50;0;100” gets anywhere a ‘_’ joined at the beginning. But I do not see where and so I thoughed maybe Icinga could it do.

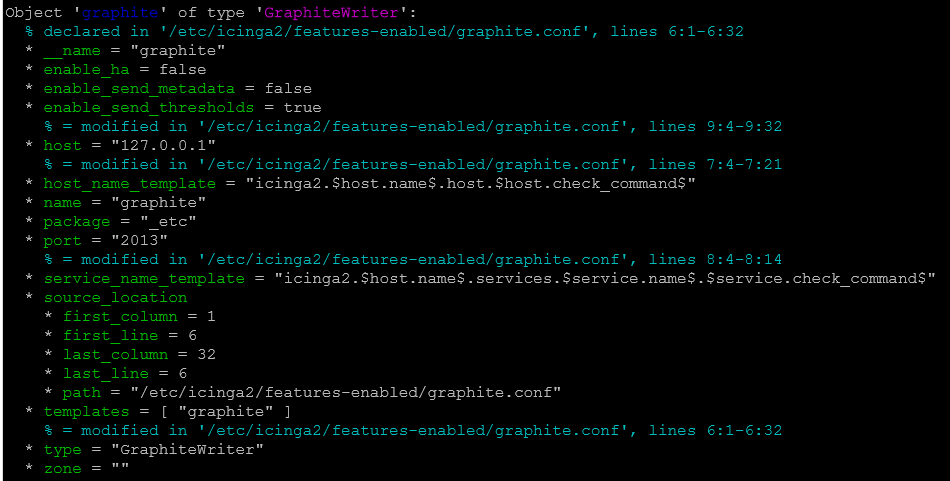
We use check_nwc_health. All perfdata folders have a ‘_’ at the beginning:


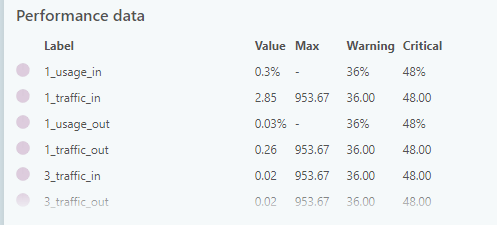
But Icinga do not show the same names:
icinga perfdata
Many thanks for your help!

Hi Log1c,
can I remove the enclosing single qoutes from the name for the performance data:
lo_In=0.00Bits/s;9800000.0;9900000.0;0;10000000
Instead of
'lo_In'=0.00Bits/s;9800000.0;9900000.0;0;10000000

The single quotes are only required if the label contains spaces, but in your case it shouldn’t have a negative effect.
Also Bits/s is not a valid unit for performance data, missed that before
See Monitoring Plugins Development Guidelines

Hi,
“Bits/s” came from the old tool I translated to python.
The new tool has an option to switch the unit to correct format.
Do you have any other idea, what I can do, to solve the problem with the leading underscore?

Let the script print the interface_name before replacing.
Maybe then you can figure out where that _ comes from.

I don’t have any other ideas except for debugging the script.

I believe, it comes from the transformation from icinga.
I looked at the performance data of nwc_health:

’ 32_traffic_out’=0.00;36;48;0;1907.3486
‘Telemax DXC und Proservia_usage_in’=0.00%;36;48;0;100

The first line has an empty space. This is replaced by “_” in the folder name: “32_traffic_out"
The second line does not have the empty space and not the leading "
”: “Telemax_DXC_und_Proservia_usage_in”
My conclusiion is that the transformation in icinga does not proof for quotes but replaces all extra empty spaces. After this transformation the string does not have a quote as first char anymore and they are not removed from the string. So it looks for me.
Example: The perfdata send by a check to icinga looks like

‘data1’=0.00;36;48;0;1907.3486 ‘data2’=0.00;36;48;0;1907.3486 //two empty spaces before ‘data2’

The resulting strings for the perfdata folder names look as:

data1
_‘data2’

I try to validate this by sending a perfdata string with my speculation.

I’m out of ideas.
Maybe open an issue on the modules github and explain your problem with some examples there.
Might be quicker to get an answer from on of the devs there than here.

Fix is in progress: