I am having an issue with Icinga 2’s Graphite-Web module. The module has been working perfectly in our fairly large Icinga deployment for a year now. Recently I changed a custom Solaris filesystem size check to return perfdata instead of just text output. This works fine on any host with up to ~10-20 results, but any hosts with more than this will cause issues with graphite.
So example host A below with only 3 filesystems being checked works just fine:
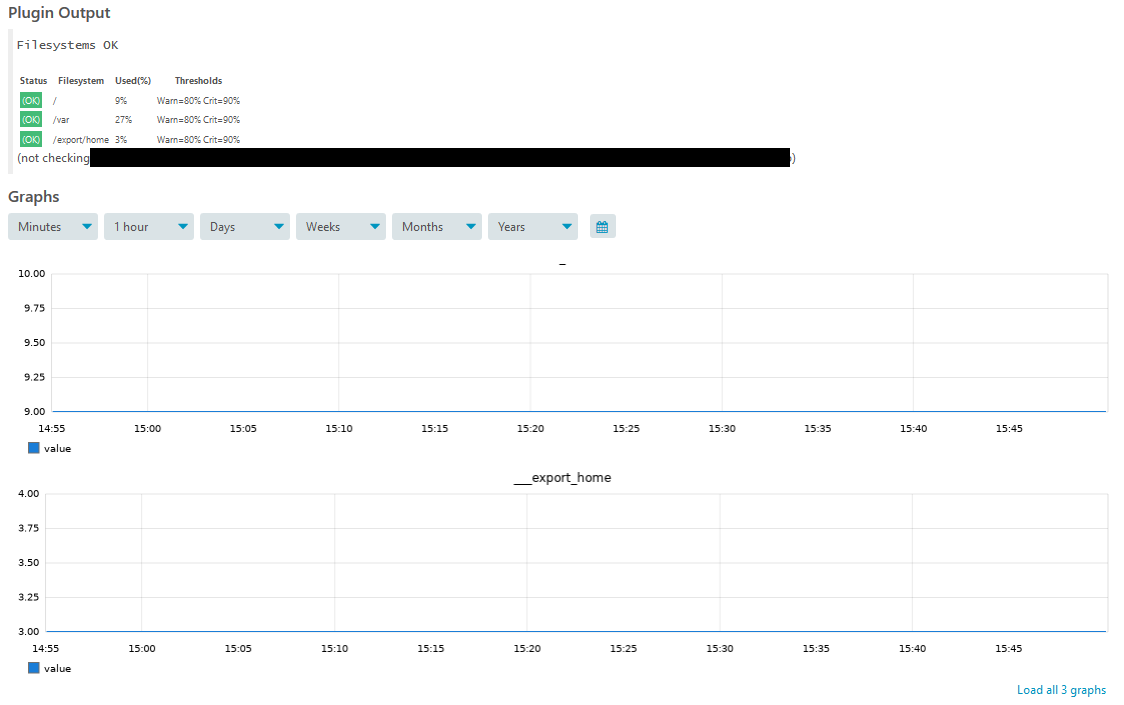
However, host B with 20+ filesystems returns a 500 error
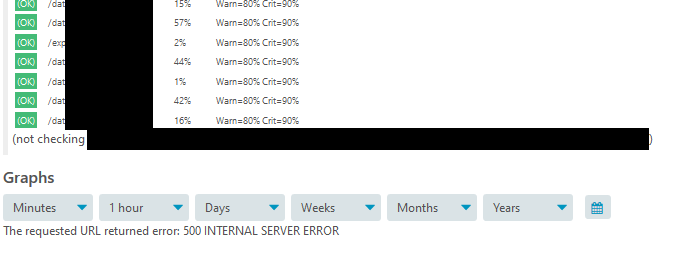
In the Graphite-Web access log I can see the call being made:
[22/Jun/2020:16:16:33 +1000] "GET /metrics/expand?query=icinga2.hostA.services.Filesystems.nrpe.perfdata.%2A.value HTTP/1.1" 500 139009
But nothing appears in the Graphite Web/Icinga/Apache error logs to give any info on the actual 500 error.
Furthermore, if I plug that URL into a browser or poll it from curl it works without issue and returns with a 200.
Is there some sort of limit in a config file that I’m missing, or was the Graphite Web plugin just not designed to handle large numbers of graphs on a single Icinga service object?
If anyone has any ideas on where the issue may lie or what I could do to get more information out of Icinga about the 500 error, it would be greatly appreciated.
Details
Icinga 2 version: 2.11.2-1
Icinga Web 2 version: 2.7.3
Graphite version: 1.1.0
OS: CentOS 7.6.1810
