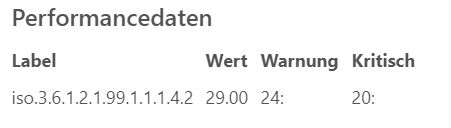
I use the plugin check_snmp to display the relative humidity of a sensor. Here I want to check for warning and critical values and a low humidity is worse. Thus the warning value is e.g. with 25% and the critical one with 20%. In the plugin I can also specify this well with the parameters -w 25: and -c 20:.
Now I would like to have these values in my display of the icinga2web graphite-plugin . Is there a way to change this in the template? Now I don’t have any output. I think it’s because the values of “25:” and “20:” are not presentable.
I’ve already added a customized template. But my question is more pointing to the fact, that I don’t have a clue how to add max and min-lines in a reverse logic to graphite as I described. For the humidity high values are good and lower values are bad. This is done by implementing the parameters of warning and critical in the check plugin using the colon after the specific value. If I do this icinga2 is working perfect and doesn’t show any warning if the humidity is high. But I’m not able to present the critical and warning levels in the diagram of the graphite module.
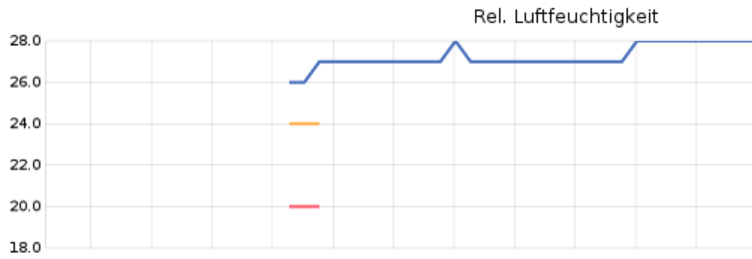
The presenting of such levels is working in principle as you can see in the snapshot I append at the beginning of the graph. But only if I add the values of warning and critical in the normal way without a colon. But then the icinga2 is in warning state.
I thought of a way in the graphite template to get rid of the colon.
That’s a problem with Icinga 2 not parsing the threshold ranges correctly and as such, they are not written to Graphite’s backend. There’s no short-term solution other than writing a wrapper script which parses the performance data and puts in parsable threshold levels on execution.