hi all i have installed graphite module in my icingaweb2 (centos 6) , i have done everything right no errors while installing but when i click the hosts/services am unable to see the graphs it returns me The requested URL returned error: 403 Forbidden
Same issue here. Did you find a solution in the meantime?
Apache Access Log says:
192.168.2.223 - - [07/May/2020:10:42:48 +0200] "GET /icingaweb2/authentication/login?redirect=graphite%2Fgraph%2Fservice%2Fmetr ics%2Fexpand%3Fquery%3Dicinga2.fritzbox.services.Heizung_Home_Office.fritz.perfdata.%252A.value&_checkCookie=1 HTTP/1.1" 403 20 4 "-" "icingaweb2-module-graphite"Tried the test from there, using URL
Result:
No such template
#0 /usr/share/icingaweb2/modules/graphite/application/controllers/GraphController.php(95): Icinga\Module\Graphite\Controllers\GraphController->supplyImage()
#1 /usr/share/icingaweb2/library/vendor/Zend/Controller/Action.php(507): Icinga\Module\Graphite\Controllers\GraphController->serviceAction()
#2 /usr/share/php/Icinga/Web/Controller/Dispatcher.php(76): Zend_Controller_Action->dispatch()
#3 /usr/share/icingaweb2/library/vendor/Zend/Controller/Front.php(937): Icinga\Web\Controller\Dispatcher->dispatch()
#4 /usr/share/php/Icinga/Application/Web.php(300): Zend_Controller_Front->dispatch()
#5 /usr/share/php/Icinga/Application/webrouter.php(99): Icinga\Application\Web->dispatch()
#6 /usr/share/icingaweb2/public/index.php(4): require_once(String)
#7 {main}
Are you able to view Graphite directly without going through Icinga, and if so, are metrics populating there?
Also, the URL in the error you’re getting appears to be forwarding through the login page, so not sure this is graphite related. Are you getting a 403 when already logged into Icinga web and attempting to view the graphite module page?
No. Looks like i’m not getting graphite but icinga, thanks for pointing.
Seems like the problem is that i have both on the same machine. Is that some sort of problem?
That’s not a problem. Some questions:
- How did you setup Graphite? i.e. what web servers are running it?
- What URI and ports were it configured for?
- Are graphite and Icinga both behind a reverse proxy, and if so, is it apache, nginx or other?
- What are the connection settings you’re using in the icingaweb module as compared to the Graphite config?
Thanks everyone btw, learned a lot from your questions, i really appreciate that.
OK, after looking a bit closer i found that the graphite Webserver was only running on localhost, so i couldn’t check that. Fine, now (after fixing some missing dependencies) when i open http://192.168.2.223:8000/render? i get an image aying “No data”. Fine so far i guess. No credentials required, just working.
In Icinga2 i configured Graphite exactly as that:
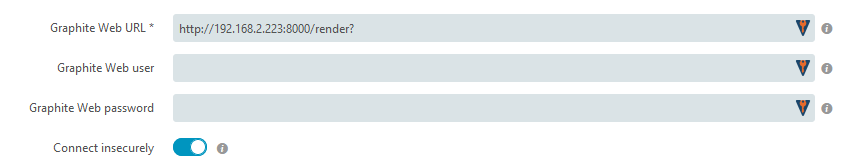
Error Message is now like this:

…but why?
/opt/graphite/storage/log/webapp/access.log says:
192.168.2.223 - - [09/May/2020:19:35:31 +0200] "GET /render/metrics/expand?query=icinga2.fritzbox.services.Heizung_Home_Office.fritz.perfdata.temperature.value HTTP/1.1" 404 236
And yes, this URI seems wrong and doesn’t work. So what exactly is wrong now?
The URI should be the dashboard homepage. So likely either / or /graphite/. It’ll be how its defined in local_settings.py in the django project folder.
Ah, fine. Now the error is gone. I don’t get any metrics, but that’s another point i will probably be able to clarify myself
+++ Fetched 0 metric(s) from 'http://192.168.2.223:8000/metrics/expand?query=icinga2.fritzbox.services.Heizung_Wohnzimmer.fritz.perfdata.%2A.value'
Thanks again for helping!