I am trying to implement the check_disk plugin with the boolean value –inode-perfdata and to build matching graphite graphs.
The Check-Command is the following:
/usr/lib64/nagios/plugins/check_disk ‘-K’ ‘10%’ ‘-W’ ‘15%’ ‘-c’ ‘5%’ ‘-w’ ‘10%’ ‘-p’ ‘/home’ --inode-perfdata
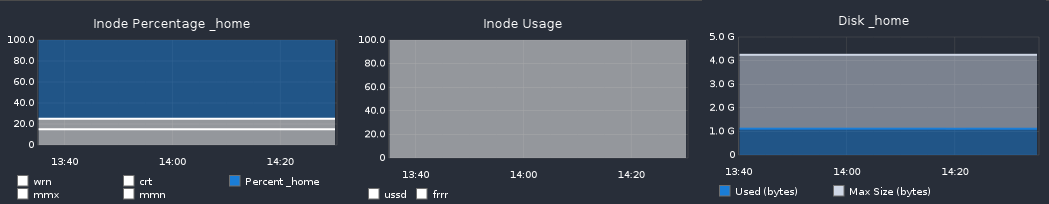
My Goal is to let the graphs look somewhat like this:
However, it just looks like this (look specifically at the last four graphs):
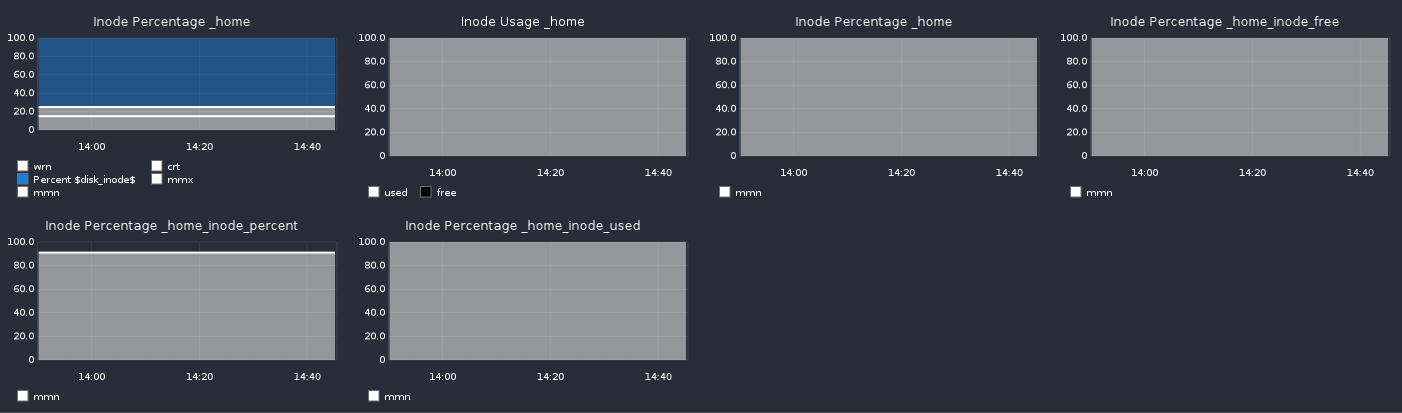
Graphite interprets the four perfdata-directories as four different “disks”.
My graphite-template INI looks like this:
[disk_inode_percent.graph]
check_command = "disk123"

[disk_inode_percent.metrics_filters]
inode_percent_warn  = "$service_name_template$.perfdata.$disk2$_inode_percent.warn"
inode_percent_crit  = "$service_name_template$.perfdata.$disk2$_inode_percent.crit"
inode_percent_value = "$service_name_template$.perfdata.$disk2$_inode_percent.value"
inode_percent_max   = "$service_name_template$.perfdata.$disk2$_inode_percent.max"
inode_percent_min   = "$service_name_template$.perfdata.$disk2$_inode_percent.min"

[disk_inode_percent.urlparams]
areaAlpha = "0.5"
areaMode = "stacked"
lineWidth = "2"
min = "0"
max = "100"
title = "Inode Percentage $disk2$"
yStep = "20"

[disk_inode_percent.functions]
inode_percent_warn  = "alias(color($metric$, '#ffffff'), 'wrn')"
inode_percent_crit  = "alias(color($metric$, '#ffffff'), 'crt')"
inode_percent_value = "alias(color($metric$, '#1a7dd7'), 'Percent $disk2$')"
inode_percent_max   = "alias(color($metric$, '#ffffff'), 'mmx')"
inode_percent_min   = "alias(color($metric$, '#ffffff'), 'mmn')"

[disk_inode_usage.graph]
check_command = "disk123"

[disk_inode_usage.metrics_filters]
inode_used_value = "$service_name_template$.perfdata.$disk1$_inode_used.value"
inode_free_value = "$service_name_template$.perfdata.$disk1$_inode_free.value"

[disk_inode_usage.urlparams]
areaAlpha = "0.5"
areaMode = "all"
lineWidth = "2"
min = "0"
max = "100"
title = "Inode Usage $disk1$"
yStep = "20"

[disk_inode_usage.functions]
inode_free_value = "alias(color($metric$, '#000000'), 'free')"
inode_used_value = "alias(color($metric$, '#ffffff'), 'used')"

[disk_usage.graph]
check_command = "disk123"

[disk_usage.metrics_filters]
disk_usage_value = "$service_name_template$.perfdata.$disk3$.value"

[disk_usage.urlparams]
areaAlpha = "0.5"
areaMode = "stacked"
lineWidth = "2"
min = "0"
max = "100"
title = "Inode Percentage $disk3$"
yStep = "20"

[disk_usage.functions]
disk_usage_value = "alias(color($metric$, '#ffffff'), 'value')"
It is just an example that I use for developing, so don’t bother some of the stupid names or abbreviations.
As soon as i remove the “disk_usage”, the last of the three areas, I get nearly the solution.
I believe the problem is that the performancedata directories have the same prefix ( “_home” in this case) and if it was inode_(percent|used|free)_home instead, it would work:
ls /var/lib/graphite/whisper/icinga2/hostname/services/s/service_name_template/perfdata/
_home
_home_inode_free
_home_inode_percent
_home_inode_used
If course I only tested with /home , a lot mountpoints would follow. If there was a mountpoint like /home/inode/ that would also look like the above example. I think that’s the reason the correct syntax can not be determinded by graphite.
I tried to play a bit with urlparams but could get it to work.
I would be very happy if you could give me any more tips.