Graphite not receiving Performance Data

Hello everybody,

my Issue is similar to Issue: GraphiteWriter not writing Performance Data to Carbon-Cache but the solution there didn’t help.
root@ubuntu:/home/ubuntu# icinga2 --version
icinga2 - The Icinga 2 network monitoring daemon (version: v2.12.0-rc1-7-g2e22ce b23)

Copyright (c) 2012-2020 Icinga GmbH (https://icinga.com/)
License GPLv2+: GNU GPL version 2 or later <http://gnu.org/licenses/gpl2.html>
This is free software: you are free to change and redistribute it.
There is NO WARRANTY, to the extent permitted by law.

System information:
  Platform: Ubuntu
  Platform version: 20.04 LTS (Focal Fossa)
  Kernel: Linux
  Kernel version: 5.4.0-1011-raspi
  Architecture: armv7l

Build information:
  Compiler: GNU 8.3.0
  Build host: runner-LTrJQZ9N-project-297-concurrent-0
  OpenSSL version: OpenSSL 1.1.1g  21 Apr 2020

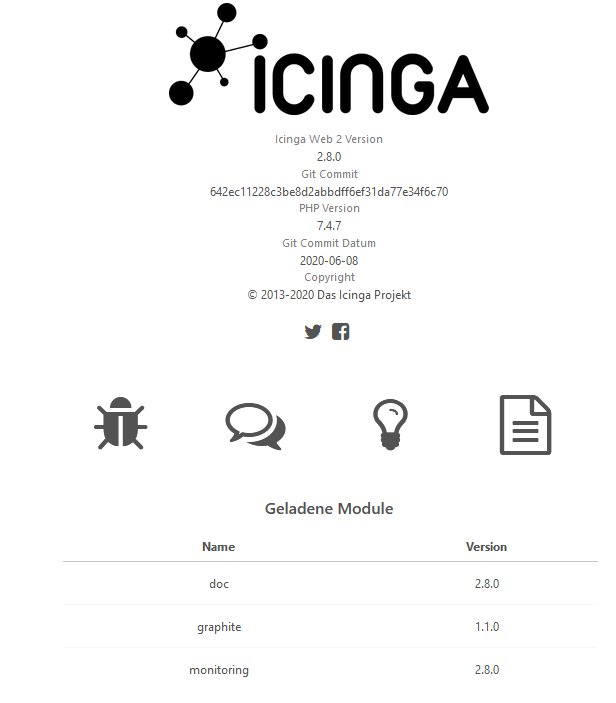
Application information:

General paths:
  Config directory: /etc/icinga2
  Data directory: /var/lib/icinga2
  Log directory: /var/log/icinga2
  Cache directory: /var/cache/icinga2
  Spool directory: /var/spool/icinga2
  Run directory: /run/icinga2

Old paths (deprecated):
  Installation root: /usr
  Sysconf directory: /etc
  Run directory (base): /run
  Local state directory: /var

Internal paths:
  Package data directory: /usr/share/icinga2
  State path: /var/lib/icinga2/icinga2.state
  Modified attributes path: /var/lib/icinga2/modified-attributes.conf
  Objects path: /var/cache/icinga2/icinga2.debug
  Vars path: /var/cache/icinga2/icinga2.vars
  PID path: /run/icinga2/icinga2.pid

root@ubuntu:/home/ubuntu# icinga2 feature list
Disabled features: api compatlog debuglog elasticsearch gelf icingadb influxdb livestatus opentsdb perfdata statusdata syslog

Enabled features: checker command graphite ido-mysql mainlog notification

Does anyone have a clue where i could search?

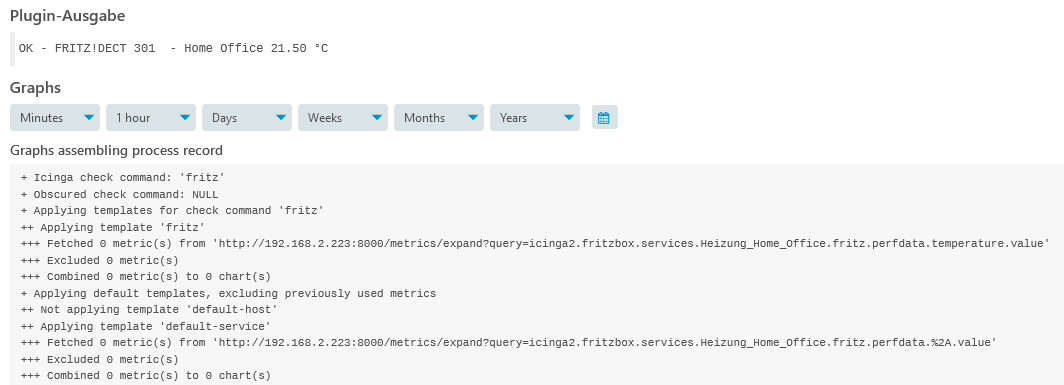
Is the data completely missing or only for certain checks?

To start debugging, you could try to send something from your Icinga 2 server to your Graphite server manually, just to make sure the network and Graphite itself are working properly:

echo "test.bash.stats 42 `date +%s`" | nc graphite.example.com 2003
1 Like

It’s missing completely. Netcat hangs open and never finishes:

root@ubuntu:/home/ubuntu# echo "test.bash.stats 42 `date +%s`" | nc -v 192.168.2.223 2003
Connection to 192.168.2.223 2003 port [tcp/cfinger] succeeded!

Since the connection seems to work, I would exclude network issues.

Did you check your graphite logs? Usually they are located in /opt/graphite/storage/log/carbon-cache, but this may be different depending on your installation. Check the LOG_DIR option in your carbon.conf

Espacially the creates.log could be interesting. You may have to set LOG_CREATES = True in your carbon.conf.

Hm, enabled LOG_CREATES. But nothing happens, especially no activity in the carbon-cache logs. Really weird. Logs show that carbon-cache is starting, but no activity after that.

Rebooted whole machine, just to make sure, but makes no difference.

listener.log:
11/06/2020 09:18:48 :: MetricLineReceiver connection with 127.0.0.1:45842 established

Did you make any changes on the enable_perfdata option? It’s set to true by default, but maybe it has been changed in your configuration.

At least it looks like that:

root@ubuntu:/# icinga2 object list --type service | grep enable_perfdata
  * enable_perfdata = true
  * enable_perfdata = true
  * enable_perfdata = true
  * enable_perfdata = true
  * enable_perfdata = true
  * enable_perfdata = true
  * enable_perfdata = true
  * enable_perfdata = true
  * enable_perfdata = true
  * enable_perfdata = true
  * enable_perfdata = true
  * enable_perfdata = true
  * enable_perfdata = true
  * enable_perfdata = true
  * enable_perfdata = true
  * enable_perfdata = true
  * enable_perfdata = true
  * enable_perfdata = true
  * enable_perfdata = true
  * enable_perfdata = true
  * enable_perfdata = true
  * enable_perfdata = true
  * enable_perfdata = true

Actually, see this:

whisper-fetch --pretty /var/lib/graphite/whisper/icinga2/fritzbox/services/Heizung_Home_Office/fritz/perfdata/temperature/value.wsp
[...]
Tue Jun 30 14:42:00 2020        21.500000
Tue Jun 30 14:43:00 2020        21.500000
Tue Jun 30 14:44:00 2020        21.500000
Tue Jun 30 14:45:00 2020        21.500000
Tue Jun 30 14:46:00 2020        21.500000
Tue Jun 30 14:47:00 2020        21.500000
Tue Jun 30 14:48:00 2020        21.500000
Tue Jun 30 14:49:00 2020        21.500000
Tue Jun 30 14:50:00 2020        21.500000
Tue Jun 30 14:51:00 2020        21.500000
Tue Jun 30 14:52:00 2020        21.500000
Tue Jun 30 14:53:00 2020        21.500000
Tue Jun 30 14:54:00 2020        21.500000
Tue Jun 30 14:55:00 2020        21.500000
Tue Jun 30 14:56:00 2020        21.500000
Tue Jun 30 14:57:00 2020        21.500000
Tue Jun 30 14:58:00 2020        21.500000
Tue Jun 30 14:59:00 2020        None
Tue Jun 30 15:00:00 2020        21.500000
Tue Jun 30 15:01:00 2020        21.500000
Tue Jun 30 15:02:00 2020        21.500000
Tue Jun 30 15:03:00 2020        21.500000
Tue Jun 30 15:04:00 2020        21.500000
Tue Jun 30 15:05:00 2020        21.500000
Tue Jun 30 15:06:00 2020        21.500000
Tue Jun 30 15:07:00 2020        21.500000

So there is data arriving. But why doesnt’graphite find it?

local_settings.py says:

CONF_DIR = '/etc/graphite'
STORAGE_DIR = '/var/lib/graphite/whisper'
STATIC_ROOT = '/usr/share/graphite-web/static'
LOG_DIR = '/var/log/graphite'
INDEX_FILE = '/var/lib/graphite/search_index'
[...]
WHISPER_DIR = '/var/lib/graphite/whisper'

Can you show the graphite templates “fritz” and “default-service”?

Maybe they are not correct to fetch the metrics.

Sure.

fritz:

[fritz.graph]
check_command = "fritz, Heizung_Home_Office"

[fritz.metrics_filters]
temperatur = "$service_name_template$.perfdata.temperature.value"

[fritz.urlparams]
areaAlpha = "0.5"
areaMode = "all"
lineWidth = "2"
min = "0"
yUnitSystem = "none"

[fritz.functions]
temperatur = "alias(color($metric$, '#1a7dd7'), '°C')"

default:

[default-host.metrics_filters]
value = "$host_name_template$.perfdata.$perfdata$.value"

[default-host.urlparams]
areaAlpha = "0.5"
areaMode = "all"
lineWidth = "2"
title = "$perfdata$"
yUnitSystem = "none"

[default-host.functions]
value = "alias(color($metric$, '#1a7dd7'), 'value')"


[default-service.metrics_filters]
value = "$service_name_template$.perfdata.$perfdata$.value"

[default-service.urlparams]
areaAlpha = "0.5"
areaMode = "all"
lineWidth = "2"
title = "$perfdata$"
yUnitSystem = "none"

[default-service.functions]
value = "alias(color($metric$, '#1a7dd7'), 'value')"

Hm, they look good.

Are the perfdata graphs displayed in Graphite Web?

You mean, on the Dashboard? Looks like this:


Or the Main View?tree

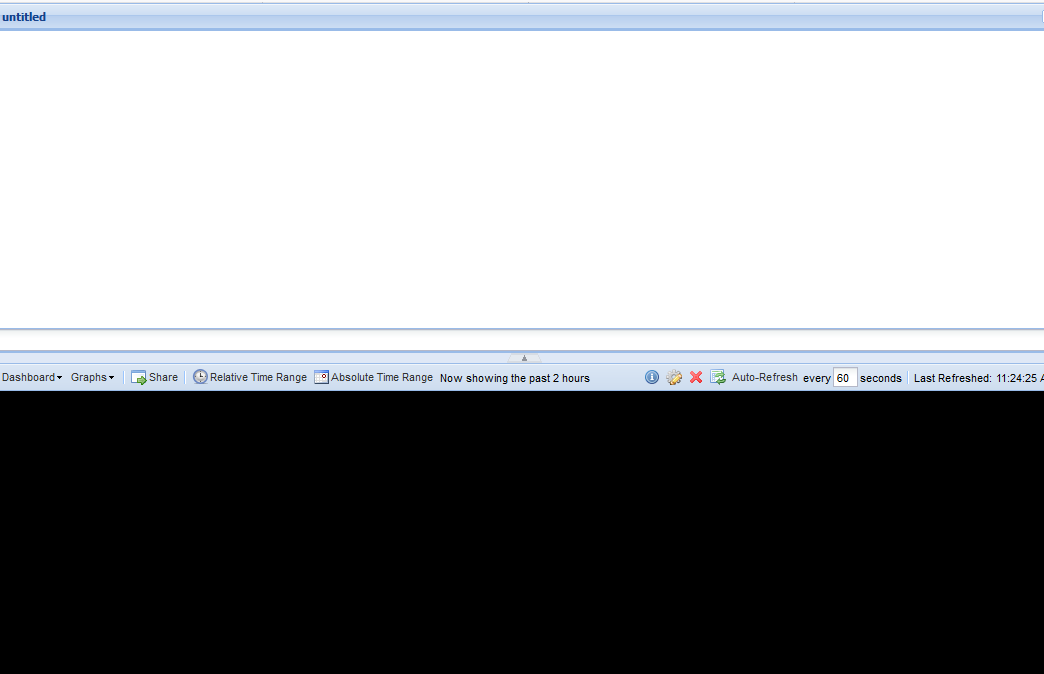
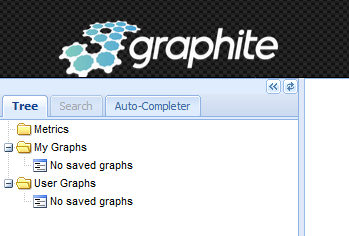
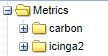
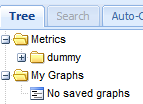
Looks like graphite does not know the data or any data at all.
There is no icinga2 folder under metrics.

Maybe check your configs again if there is anything missing.
There are two good guides around here, both worked for me in the past for setting up graphite.

Hm, been through those already but double-checked everything and fixed some permissions - no improvement though.

But i did stumble upon a weird version inconsistency. If i say:

root@ubuntu:~# pip3 install graphite-web
Requirement already satisfied: graphite-web in /usr/local/lib/python3.8/dist-packages (1.1.7)

I get 1.1.7, but the Icinga Web interface “About” says:


Wait…what? There are two versions? But where?

What you see in Icinga Web 2 is the version of the graphite module for Icinga Web 2 (the “stuff” you pulled from github).

After fixing the permissions did you restart the services?

Yes, i did. I’m wondering where this empty “Metrics” tree would be built. I suspect something is searching for something in the wrong place.

I think so too.
“Normally” the tree should at least have these two folders:
image

As you have files in

the carbon daemon is working ok getting data from icinga2.
So my guess is that there is some false config for graphite web.

My local_settings.py is very tiny (if excluded the commented lines) after installing with https://community.icinga.com/t/ubuntu-18-04-bionic-graphite-guide/1327:

 cat local_settings.py | egrep -v "^#|^$"
SECRET_KEY = 'key'
ALLOWED_HOSTS = [ '*' ]
TIME_ZONE = 'Europe/Berlin'
DEFAULT_XFILES_FACTOR = 0
WHISPER_DIR = '/var/lib/graphite/whisper'
FUNCTION_PLUGINS = []

Other than that I’m currently out of ideas :confused:

Hm, mine is much more complicated…

root@ubuntu:~# cat /etc/graphite/local_settings.py | egrep -v "^#|^$"
SECRET_KEY = 'dgfhfjdriet348t4i2t209TGOIERPIGwq'
TIME_ZONE = 'Europe/Berlin'
LOG_ROTATION = True
LOG_ROTATION_COUNT = 2
DEFAULT_XFILES_FACTOR = 0
CONF_DIR = '/etc/graphite'
STATIC_ROOT = '/usr/share/graphite-web/static'
LOG_DIR = '/var/log/graphite'
INDEX_FILE = '/var/lib/graphite/search_index'
WHISPER_DIR = '/var/lib/graphite/whisper'
DATABASES = {
    'default': {
        'NAME': '/var/lib/graphite/graphite.db',
        'ENGINE': 'django.db.backends.sqlite3',
        'USER': '',
        'PASSWORD': '',
        'HOST': '',
        'PORT': ''
    }
}
FUNCTION_PLUGINS = []

But…after reverting the setting for Storage_Dir to its default, the situation is now like this:
tree

At least something changed :smiley:

I would now compare the permissions of the folder where the “dummy” folder is located and the /var/lib/graphite/whisper

Or just change the storage location of the carbon cache daemon.

Maybe this can shed some light on this:

root@ubuntu:/var/lib/graphite/whisper# PYTHONPATH=/opt/graphite/webapp  /opt/graphite/webapp/manage.py makemigrations --settings=graphite.settings
WARNING: whisper module could not be loaded, whisper support disabled

but:

root@ubuntu:/var/lib/graphite/whisper# pip install whisper
Requirement already satisfied: whisper in /usr/local/lib/python3.8/dist-packages (1.1.7)
Requirement already satisfied: six in /usr/lib/python3/dist-packages (from whisper) (1.14.0)